After 20 years of exponential growth, the carbon footprint of computing is now greater than that of Saudi Arabia (European Commission, 2025, and The World Bank, 2024). But increased public awareness of the IT sector’s emissions impact has facilitated new ways of thinking about how we use digital services: carbon-aware computing. These strategies aim to reduce the emissions impact of computing processes, by prioritising renewable energy consumption.
Carbon-aware computing can be implemented in three ways: time shifting, location shifting, and demand shifting. Time and location shifting strategies have been practiced by GreenOps specialists for several years, but recent research suggests that their effectiveness can be limited if not implemented without awareness of a new, third aspect of carbon-aware computing: electricity demand.
Time Shifting
What is it?
Scheduling computing loads during periods when the local power grid is primarily generating renewable energy.
How do I do it?
Identify which data centers your workloads are based in, then find the grid mix of the country in which they are located. Consult the country’s grid operator to identify time periods where the carbon intensity of the grid is lowest, and schedule time-specific workloads during these periods.
Example:
In Spain, an excess of solar power around midday means that the grid is greenest between 11am and 3pm.

Source: Electricity Maps, 2026
What do I need to consider?
If you have workloads with predictable durations that can run at any time of day, time-shifting is a simple strategy to reduce your overall emissions from computing. However, on a larger scale, time-shifting does not actually reduce overall carbon emissions at the national level: it simply shifts energy consumption from one period to another. Because grid loads are preplanned, moving your workload to a low carbon time period doesn’t change the overall emissions generated by your grid.
Location Shifting
What is it?
Migrating workloads to data centers in countries with a low carbon intensity grid.
How do I do it?
Identify which data centers your workloads are based in and assess the carbon intensity of the national or local grid mix that powers them. Then, migrate those workloads to data centers in a location where the local grid mix is powered by a higher percentage of renewable energy sources.
Example:
The variety in carbon intensities of European grid mixes in February 2026, ranging from 16 gCO2e/kWh in Sweden to 625 gCO2e/kWh in Poland.

Source: Electricity Maps, 2026
What do I need to consider?
Workloads that are not restricted to one location by cloud service provider licensing or data sovereignty requirements can usually be migrated to alternative data centers without significant reconfiguration. It is important to assess whether the new data center location has the required hardware to maintain your original workload, as not all cloud services or providers are available in every country. From a carbon emissions perspective, location shifting operates similarly to time shifting, in that it is very effective at reducing an organization’s cloud emissions, but the overall impact on global emissions may be limited. This is because location shifting can cause a spike in demand in low carbon countries, which is offset with fossil fuel reserves or imported power from fossil fuel sources.
Demand Shifting
What is it?
Running workloads when demand for electricity is low to use energy that would otherwise have been curtailed.
Energy curtailment is the deliberate reduction of energy generation. Power suppliers curtail their energy sources when public demand is low, because the subsequent energy cannot be stored. Curtailment is primarily applied to renewable sources, because they cannot be managed or stored in the same way as finite fossil sources.
By shifting compute workloads to periods of time when public power demand is low in locations where renewables make up a large portion of the grid mix, such as overnight wind power, you signal to power suppliers that there is a demand for renewable energy that would otherwise not be being generated.
How do I do it?
Identify which data centers your workloads are based in. Then, find locations that utilise more renewable energy during periods of low power demand. Migrate your workloads to these locations, during these time periods.
Example:
The UK’s grid mix between 5pm and 10am – most of the UK’s energy is sourced via wind power between midnight and 6am, at the same time as overall power consumption drops.

Source: Electricity Maps, 2026
What do I need to consider?
The overlap between high renewable usage and low power demand can be difficult to predict and is subject to daily fluctuations. Complex compute processes do not align well with such a spontaneous schedule, but an awareness of electricity demand in combination with location and time scheduling allows GreenOps practitioners is likely to reduce demand for fossil fuels overall – even if workload scheduling does not always overlap with the exact periods in which renewables would have been curtailed.
What Now?
The field of carbon-aware computing is ever developing. If you’re interested in reducing your organization’s carbon emissions from the cloud, get in touch with Tailpipe to discuss how location shifting can help you to utilize renewable energy for your cloud workloads. If you’d like to find out more about demand-shifting, visit Climate Action Tech’s grid-aware software github page (with thanks to Hannah Smith and Ismael Velasco for their work developing the concept of demand shifting).

Cloud computing powers over 90% of enterprises (Cloudzero, 2025), but its impact on carbon remains a black box. While standards exist for manufacturing and logistics emissions, methods for calculating the carbon costs of the cloud are so inconsistent that the two most common approaches produce results differing by 50x. With regulators closing in, that ambiguity is becoming a liability.
The cloud exists to effectively outsource computing. In a non-cloud setup, an organisation runs its own applications with physical hardware onsite. The cloud outsources this resource-heavy process by allowing organisations to rent server capacity in datacentres. This means that for the more than 90% of companies that purchase cloud computing services, the cloud is a source of Scope 3 emissions: CO2 that is emitted by activities that the company is responsible for, without burning fossil fuels onsite (Scope 1) or purchasing electricity (Scope 2).
Organisations are facing increasing pressure to report their Scope 3 emissions. The EU is leading the way in mandating Scope 3 reporting with the Corporate Sustainability Reporting Directive, and countries around the world are following suit by beginning to adopt the International Financial Reporting Standards S2 standard. As a result, organisations of all sizes, from all industries, are faced with the task of accounting for their full carbon impact for their full value and supply chain – including the cloud.
However, until recently, the carbon impact of the cloud has been poorly understood. Sustainability leaders are left to choose between wildly unreliable spend-based factors, or Cloud Service Provider (CSP) estimators with opaque methodologies and a vested interest in reporting low emissions. When given the same input data, spend-based factors deliver carbon emission figures more than 50x larger than CSP estimators. In response to this lack of clarity, organisations like Boavizta and Tailpipe have proposed a new, usage-based methodology to make cloud carbon reporting simple and accessible. Tailpipe assessed its own carbon emissions from its cloud use from January to December 2025, resulting in a figure of 553 kilograms of greenhouse gases (or, kgCO2e) – seven times smaller than spend-based factors, and eight times larger than CSP estimations.
How does the cloud generate emissions?
Every request to the cloud is routed to a server in a datacentre somewhere in the world. Cloud computing generates carbon emissions from the energy consumption of the computing equipment inside these datacentres. These servers require constant power, which increases with utilisation – the level of intensity at which the computing equipment is working. Very large, ‘hyperscale’ datacentres therefore draw a vast amount of electricity from local energy grids, and when those grids are predominantly powered by fossil fuels, it makes them responsible for the subsequent release of CO2e into the atmosphere. This demand is only growing as the world becomes increasingly digital, with datacentre energy consumption expected to more than double between 2024 and 2030 (IEA, 2025).
Spend-based Factors: Seven times too big?
Many estimations of cloud emissions currently being reported by organisations are based on spend-based factors, which use the amount of money spent by an organisation on a service as the coefficient for the organisation’s carbon emissions. The most commonly used spend-based factors for cloud are USEEIO, OpenCEDA, and EXIOBASE. These databases calculate carbon emissions per dollar spent by dividing an estimation for the total input spend on an industry by its total output emissions. These factors are unfit for purpose, overestimating emissions against a usage-based model by up to seven-fold, as the following table shows for Tailpipe’s spend and usage of cloud computing in 2025:

Spend-based emissions factors misrepresent the relationship between the usage of cloud computing and carbon emissions. There is no direct correlation between cloud spend and emissions: instead, the relationship depends on how intensively an organisation uses the cloud. It is actually possible for emissions to increase when spend drops, and vice versa. For example, Company A and Company B might be paying the same amount to host their websites in the cloud, but whilst Company A processes hundreds of visitors an hour, Company B has just a handful. In this case, Company A will be sending hundreds of requests to a cloud server, demanding hundreds of watts of power (and therefore, causing greater emissions), whilst Company B requires just a few watts of power to keep its website running.
Additionally, despite being separate data sources, these three different emissions factor models are calculated based on the same economic input and carbon output datasets, covering the period between 2007 and 2017. Not only are they outdated, but they also collate every software, data processing, and computing process under the same category: ‘data processing, hosting, and related services’ in USEEIO and OpenCEDA, and ‘computer and related services’ in EXIOBASE. Organisations that use spend-based factors therefore fail to account for the specificity of cloud usage patterns, and the differentiation between cloud workloads. They also offer no insight into how to reduce cloud emissions, beyond simply spending less – and therefore, using fewer cloud services.
Cloud Service Provider Estimations: Eight times too small?
The three big Cloud Service Providers (CSPs) – Amazon Web Services (AWS), Microsoft Azure, and Google Cloud Platform (GCP) – do provide carbon estimations to their customers. These CSPs calculate cloud emissions with varying levels of granularity, but all adopt a top-down approach that calculates either total hardware power consumption (Azure and GCP) or total datacentre power consumption (AWS) before allocating emissions to individual customers based on the proportion of server resources they have been allocated. This approach is much more reliable than spend-based factors, but it does not recognise real-time utilisation of resources.
To take one example, AWS’ Customer Carbon Footprint Tool (CCFT) delivers both location-based and market-based emissions figures with a three-month lag. Location-based emissions look at the actual carbon intensity of the grid mix that powers a datacentre and multiplies it by the power drawn by it. Market-based emissions deliver lower carbon figures because they factor in AWS’s carbon offsetting and energy matching schemes.

A usage-based model does not account for offsetting or energy matching, because it reports the actual carbon emitted into the atmosphere as a result ofelectricity consumption. AWS does not document how it accounts for the emissions figures presented in Tailpipe’s billing account, beyond the high-level, generic overview provided in its Customer Carbon Footprint Methodology, which lacks any input data that would allow customers to verify their carbon figures. The AWS customer dashboard also only delivers the two figures above, with no further granularity or recommendations for how to reduce them. Without recommendations on how to reduce their emissions from cloud computing, organisations cannot deliver actionable carbon reduction strategies – other than, again, using the cloud less.
The Tailpipe Approach: How does it work, and why should I trust it?
Tailpipe has pioneered a ground up approach to calculating cloud carbon emissions, which starts with the power draw of the hardware that an organisation is using. Drawing from an organisation’s CSP billing and operational data, computing equipment manufacturer specifications, and data aggregators like non-profit Boavizta, Tailpipe knows exactly when and where an organisation is using the cloud, their level of utilisation, and the specific CPU, RAM, and GPU models being utilised at that time, along with the average power draw of other hyperscale datacentre server equipment. It uses this data to calculate the power consumption of that hardware in 5% CPU utilisation increments, based on lab-based stress-testing of CPU, RAM, and GPU models (documented in Tailpipe’s Methodology).
With electricity consumption calculated, Tailpipe factors in the carbon intensity of the local grid that power the datacentres in which an organisation’s cloud services are located, delivering granular emissions data at the service and component level. It then compares these emissions figures with best practice models, to suggest easy-to-implement and tailored recommendations to cut cloud emissions by up to 90%. This has the additional benefit of often reducing spend with the CSPs, since energy-efficient infrastructure is often cost-efficient infrastructure.

To ensure that its data is reliable, Tailpipe carries out regular data validation tests. Tailpipe lab-tests the power consumption of bare metal and datacentre-based servers, comparing these empirical figures to those calculated using its own methodology. Tailpipe always achieves a less than 10% variance between calculated and measured power and uses these tests to fine tune its methodology.
What does this all mean?
Right now, datacentres generate as much carbon in a year as the entire aviation industry does in five months (IEA, 2025). As cloud services expand, AI consumes more energy, and day-to-day experiences become increasingly digitised, the cloud’s responsibility for global emissions will only grow. At the same time, organisations that use cloud services will be expected to understand and to cut their cloud carbon emissions, and they need the tools to do so – fast. With spend-based factors unfit for purpose, and cloud service provider estimations purposefully opaque, a new set of independent, cloud-specific tools are needed to optimise a more efficient, more sustainable cloud.
Find Out More
For a more detailed breakdown of how Tailpipe calculates emissions, see the Tailpipe Methodology. For an explanation of how Tailpipe can reduce an organization’s cloud spend and carbon emissions, see Tailpipe’s Recommendations.
To discuss what Tailpipe can do to measure and reduce your cloud computing spend and emissions, get in touch with us here.

Did you know that a short conversation with GPT-4 generates 3 grams of CO2e1? With 2.5 billion messages sent to ChatGPT every day2, it has never been more important to accurately account for the carbon impact of AI. Fortunately, in a milestone for AI sustainability, the Green Software Foundation has just released the Software Carbon Intensity for AI (SCI for AI) Specification!
The SCI for AI Specification provides a ratified framework for organizations to measure the carbon footprint of AI usage. Built out of the Software Carbon Intensity ISO specification, it addresses the specific lifecycle stages of AI and the distinct measurement metrics required for different model types, covering machine learning, LLMs, GenAI, Agentic AI, document analysis, translation, and speech recognition.
Importantly, it provides distinct methodologies for consumers and providers of AI services, apportioning responsibility to the following:
Lifecycle Stage |
| Responsibility |
Inception | → | AI Service Provider |
Design & Development | → | AI Service Provider |
Deployment | → | AI Service Provider |
Operation & Monitoring | → | Consumer |
Retirement | → | Consumer & AI Service Provider |
In short, the specification lays out how emissions should be calculated as:
(Operational Carbon + Embodied Carbon) / Functional Units
Where:
Operational Carbon is emitted during the usage of the hardware within the consumer or provider boundary.
Embodied Carbon is emitted during the manufacture, transport, and disposal of the hardware within the consumer or provider boundary.
Functional Units are specific to the model type, for example, tokens, images, inferences, FLOPs, or parameters.
For the full specification, visit the SCI for AI GitHub.
Many businesses are facing regulatory pressures to report their emissions across their entire value chain – including AI usage. For the first time, they now have a framework to do so. Tailpipe is already developing its methodology for measuring cloud-hosted AI usage in line with the SCI for AI specification. To find out more about the impact of AI on cloud emissions, read our Insights!
1 Ecologits, via HuggingFace, ‘impact of a small conversation with gpt-4′.
2 OpenAI, 2025.
Global demand for cloud computing, driven in large part by the expansion of AI, is on an ever-increasing upward trajectory. This requires a constant expansion of data center capacity, both at existing sites and from new builds. Attempting to mitigate this expansion is the pursuit of the sustainable data center: facilities that can meet the world’s need for on-demand digital services whilst also being highly energy and water efficient, compatible with local environments, and emitting zero carbon.
The first challenge: Power Usage Effectiveness
Data centers have historically faced one issue after another when it comes to sustainability. Early hyperscale data centers, built to accommodate the rollout of cloud technology in the late 2000s, were designed primarily with output in mind: approximately 1.5 times as much energy was consumed by auxiliary infrastructure like cooling, lighting, and power supply (including wastage) than by servers themselves (Statista, 2025). This metric was coined Power Usage Effectiveness, or PUE, by The Green Grid in 2007, and has been a benchmark for sustainable data center design for the last two decades. PUE expresses the ratio of energy used for computing equipment versus the total energy consumption of the data center, where a PUE of 1 would represent 100% of a data center’s energy being used purely on computing equipment. Improvements in the energy efficiency of hardware in the following years resulted in the average global PUE being around 2 (meaning that as much energy was being consumed by overheads as computing equipment).
The next step: Cooling
The next big issue to solve was the enormous energy cost of cooling data center hardware. By the mid 2010s, air-based cooling was the second largest consumer of data center power, after the computing equipment. The enormous density of high-power hardware that data centers require generates vast amounts of heat: the safe range for server rack temperature reaches 27°C, with cooling. The advent of liquid cooling systems provided an alternative to the more energy intensive air-based methods. Liquid cooling lowers a data center’s PUE as liquid is better at transferring heat away from the servers than air alone, so less energy is needed overall. With air-cooling, up to 20% of a server’s power is needed to power its fans, whilst liquid cooling replaces server-specific fans with pumps that are shared by dozens of server racks (Data Center Frontier, 2024). Liquid cooling contributes in large part to the record-low PUEs of hyperscale cloud service providers like AWS (1.15), Microsoft (1.16), and Google (1.09), in contrast to the global average of 1.56 – due, in large part, to air cooling still being the predominant cooling method across the 10,823 data centers around the world.
The inevitable side effect: Water scarcity
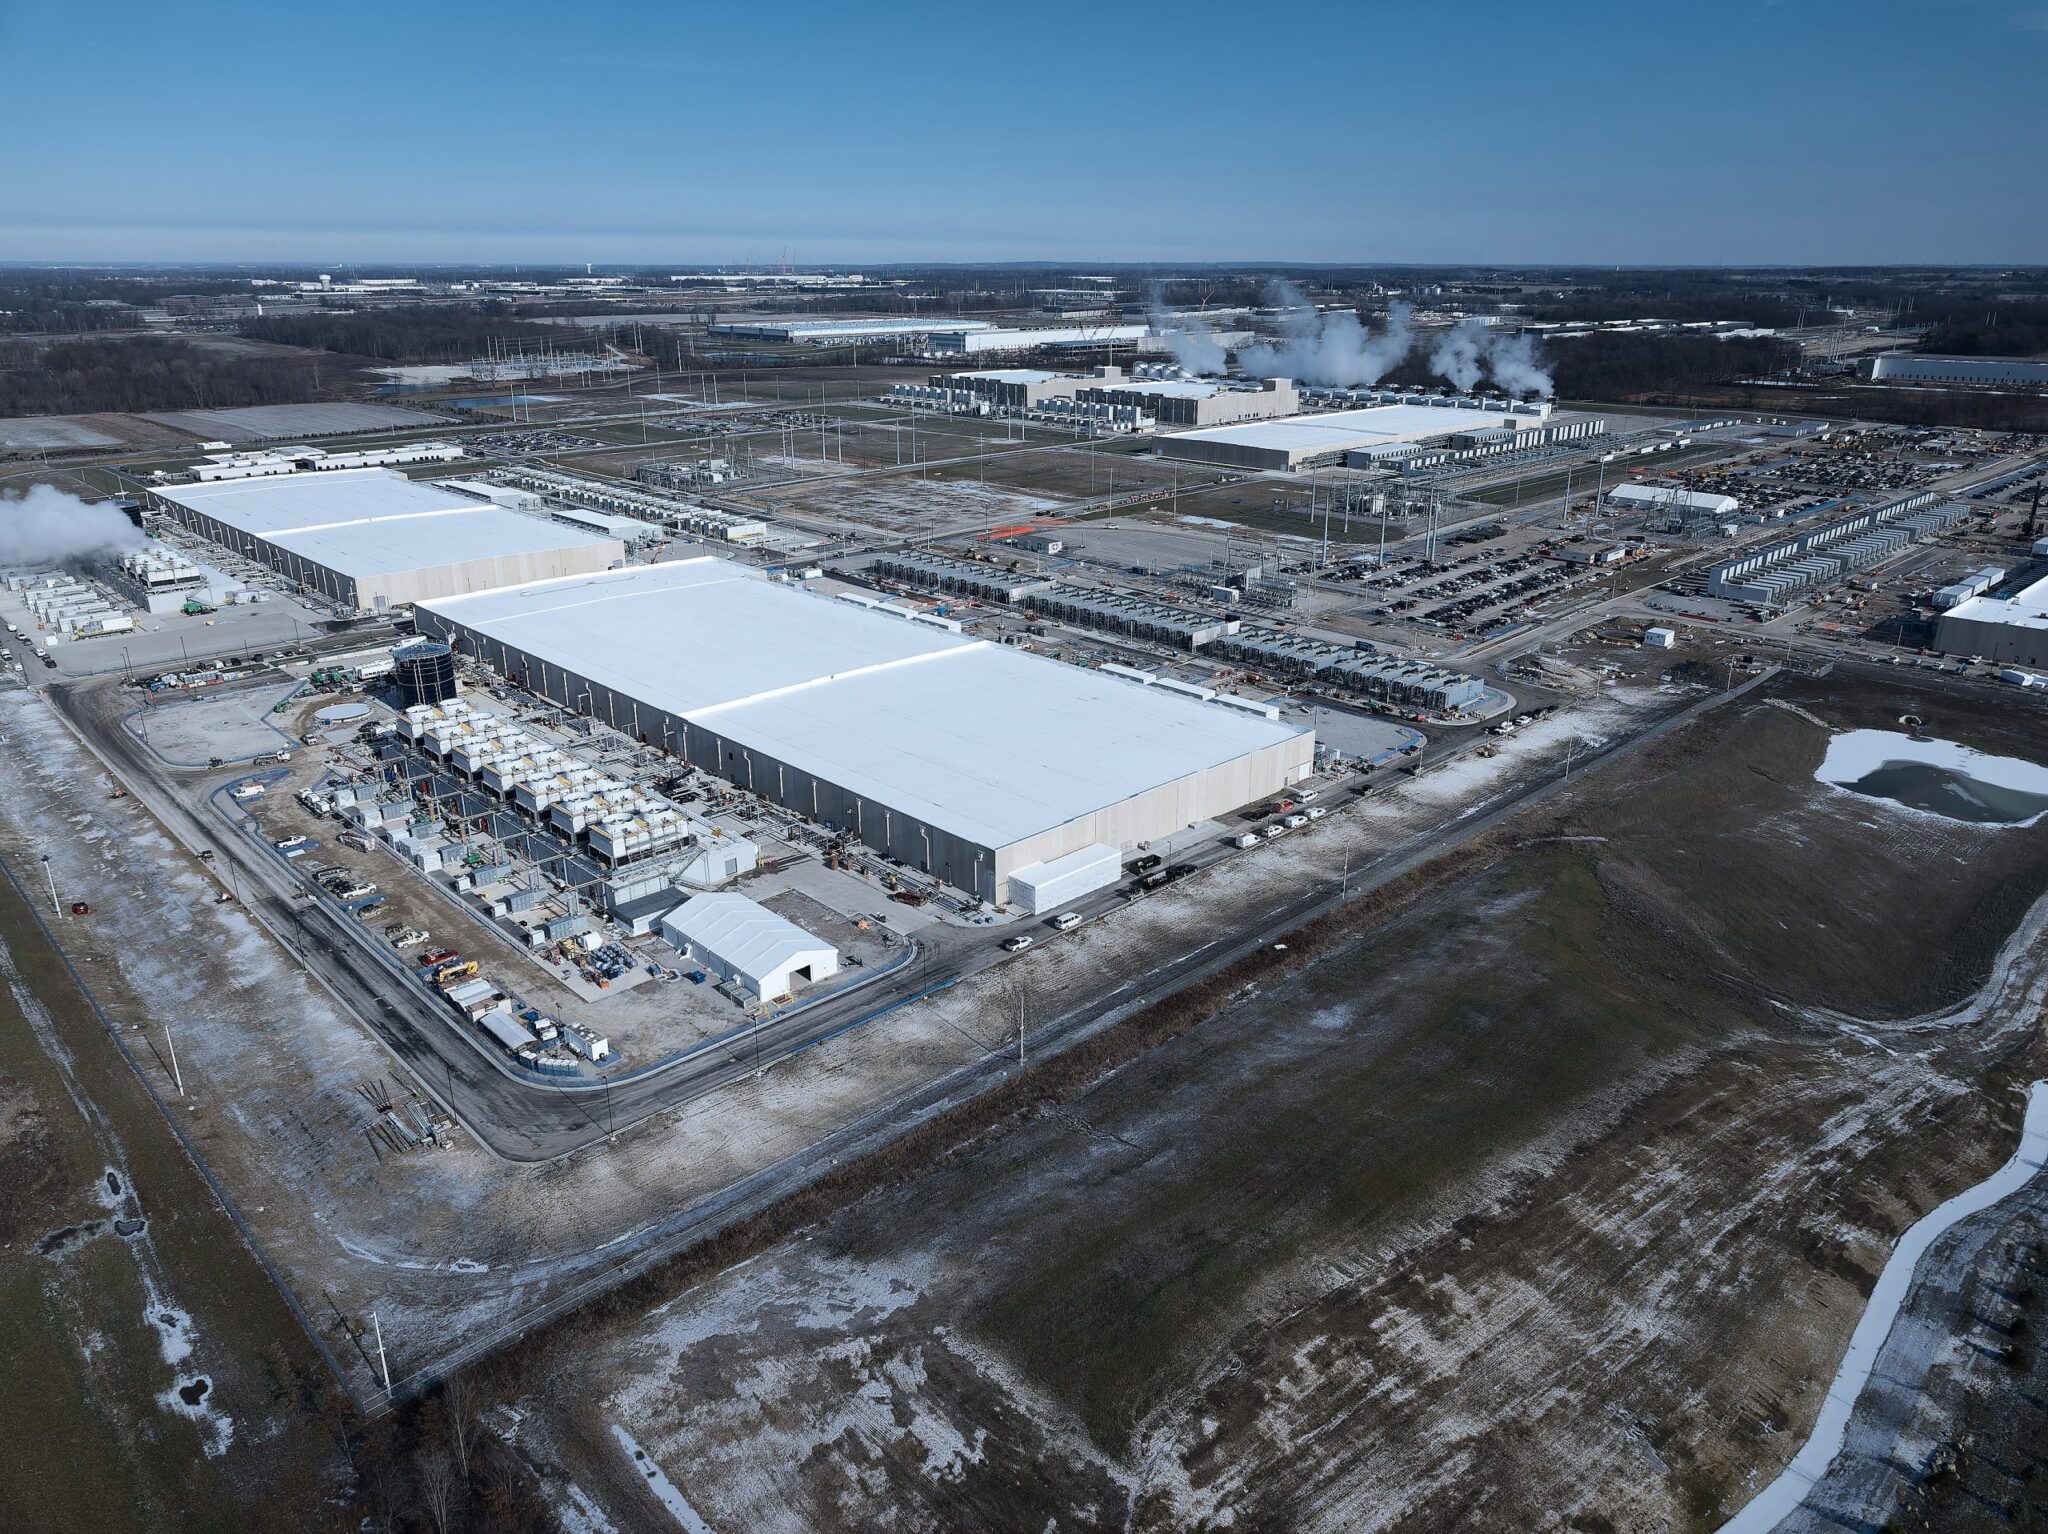
Liquid cooling may have lowered power consumption, and therefore emissions, but it created another sustainability issue: water scarcity. An open-loop liquid cooling system in a hyperscale data center can consume 19 million liters of water a day, the same as a town of 50,000 people (EESI, 2025). This puts stress on public water supplies and contributes to the depletion of freshwater habitats, an issue compounded by the popularity of water-scarce areas as data center construction zones, due to the sensitivity of data center hardware to humidity. Public backlash to headlines about the impact of water scarcity on local residents has led to the large cloud service providers investing in recycling and wastewater cooling systems; a notable example being Microsoft’s new Fairwater datacenter in Wisconsin, which (in theory) will recycle the water in its cooling system so efficiently that its yearly water consumption will be no more than a typical restaurant.
The unavoidable issue: Exponential capacity
With Microsoft’s energy-efficient PUE ratio and minimal water consumption, the Fairwater data center seems like a huge accomplishment in the pursuit of the sustainable data center. But even this cannot escape the fundamental crisis in sustainability facing the current data center industry: capacity. Fairwater might perform well on efficiency and water metrics, but it is just one of a vast crop of new data centers that will consume more power than ever before. As a specialist AI data center, Fairwater boasts hundreds of thousands of NVIDIA Blackwell GPUS, the newest development in AI processing hardware. At a bare minimum, this data center will consume as much power every day as a large US town:
100,000 NVIDIA Blackwell B200 GPUs at 50% utilization for 24 hours will consume 1,383,216 kWh of power (see the Tailpipe methodology for details).
Adding in Microsoft’s average PUE of 1.15 results in an overall power consumption figure of 1,590,698 kWh.
The average US household consumes 30kWh per day, and the average US town is comprised of between 10,000 and 50,000 homes.
1,590,698 kWh is as much power as 53,023 homes will consume per day.
This trend is not specific to Fairwater: in 2025, data centers saw an average capacity increase of 17.7% (Visual Capitalist, 2025), and the number of hyperscale data centers worldwide has more than doubled since 2020 (SRG, 2025). The efficiency gained in the last two decades may well be outpaced by the sheer increase in compute capacity in the coming years: AWS, Microsoft, and Google have publicly released plans to increase the number of data centers they own by 78% in the future (The Guardian, 2025). Greater data center capacity means greater demands on power grids, which leads to the final, and perhaps greatest issue impeding the sustainable data center: energy matching.
The false equivalence: Energy matching
Energy matching is a strategy used by organizations to offset the carbon emissions that they generate through their operations. The vast majority of data centers are powered by the national grid of the country that they are located within (rather than generating their own power), which means that their carbon emissions are directly proportional to the quantity of fossil fuels burned in powering the local grid. AWS, Microsoft, and Google all meet their self-imposed carbon reduction targets by matching the quantity of electricity that they purchase from fossil fuel-fed grids with the purchase of an equivalent quantity of renewable energy. This is beneficial in increasing the overall supply of renewable energy available to consumers and supporting the renewable economy, but it does nothing to reduce the carbon emissions actually generated by power-hungry data centers. As capacity increases, cloud service providers run the real risk of hiding their increasing carbon emission figures behind energy matching:
Google’s 2025 Sustainability Report:
For the last eight years, since 2017, we’ve matched 100% of our global electricity use with renewable energy purchases.
Google’s actual emissions: 51% increase from 2019 baseline year.
Amazon’s 2024 Sustainability Report:
100% of electricity consumed by Amazon was matched with renewable energy sources in 2024, for the second consecutive year.
Amazon’s actual emissions: 33.4% increase from 2019 baseline year.
Microsoft’s 2025 Sustainability Report:
We will reduce our Scope 1 and 2 emissions to near zero against a 2020 baseline by increasing energy efficiency, decarbonization of our operations, and reaching 100% renewable energy by 2025.
Microsoft’s actual emissions: 23.4% increase from 2020 baseline year.
Please note, actual emissions figures are taken from Google, Amazon, and Microsoft’s annual sustainability reports for all their business services; they do not publish emissions figures for their cloud provision alone.
Finally, a good example
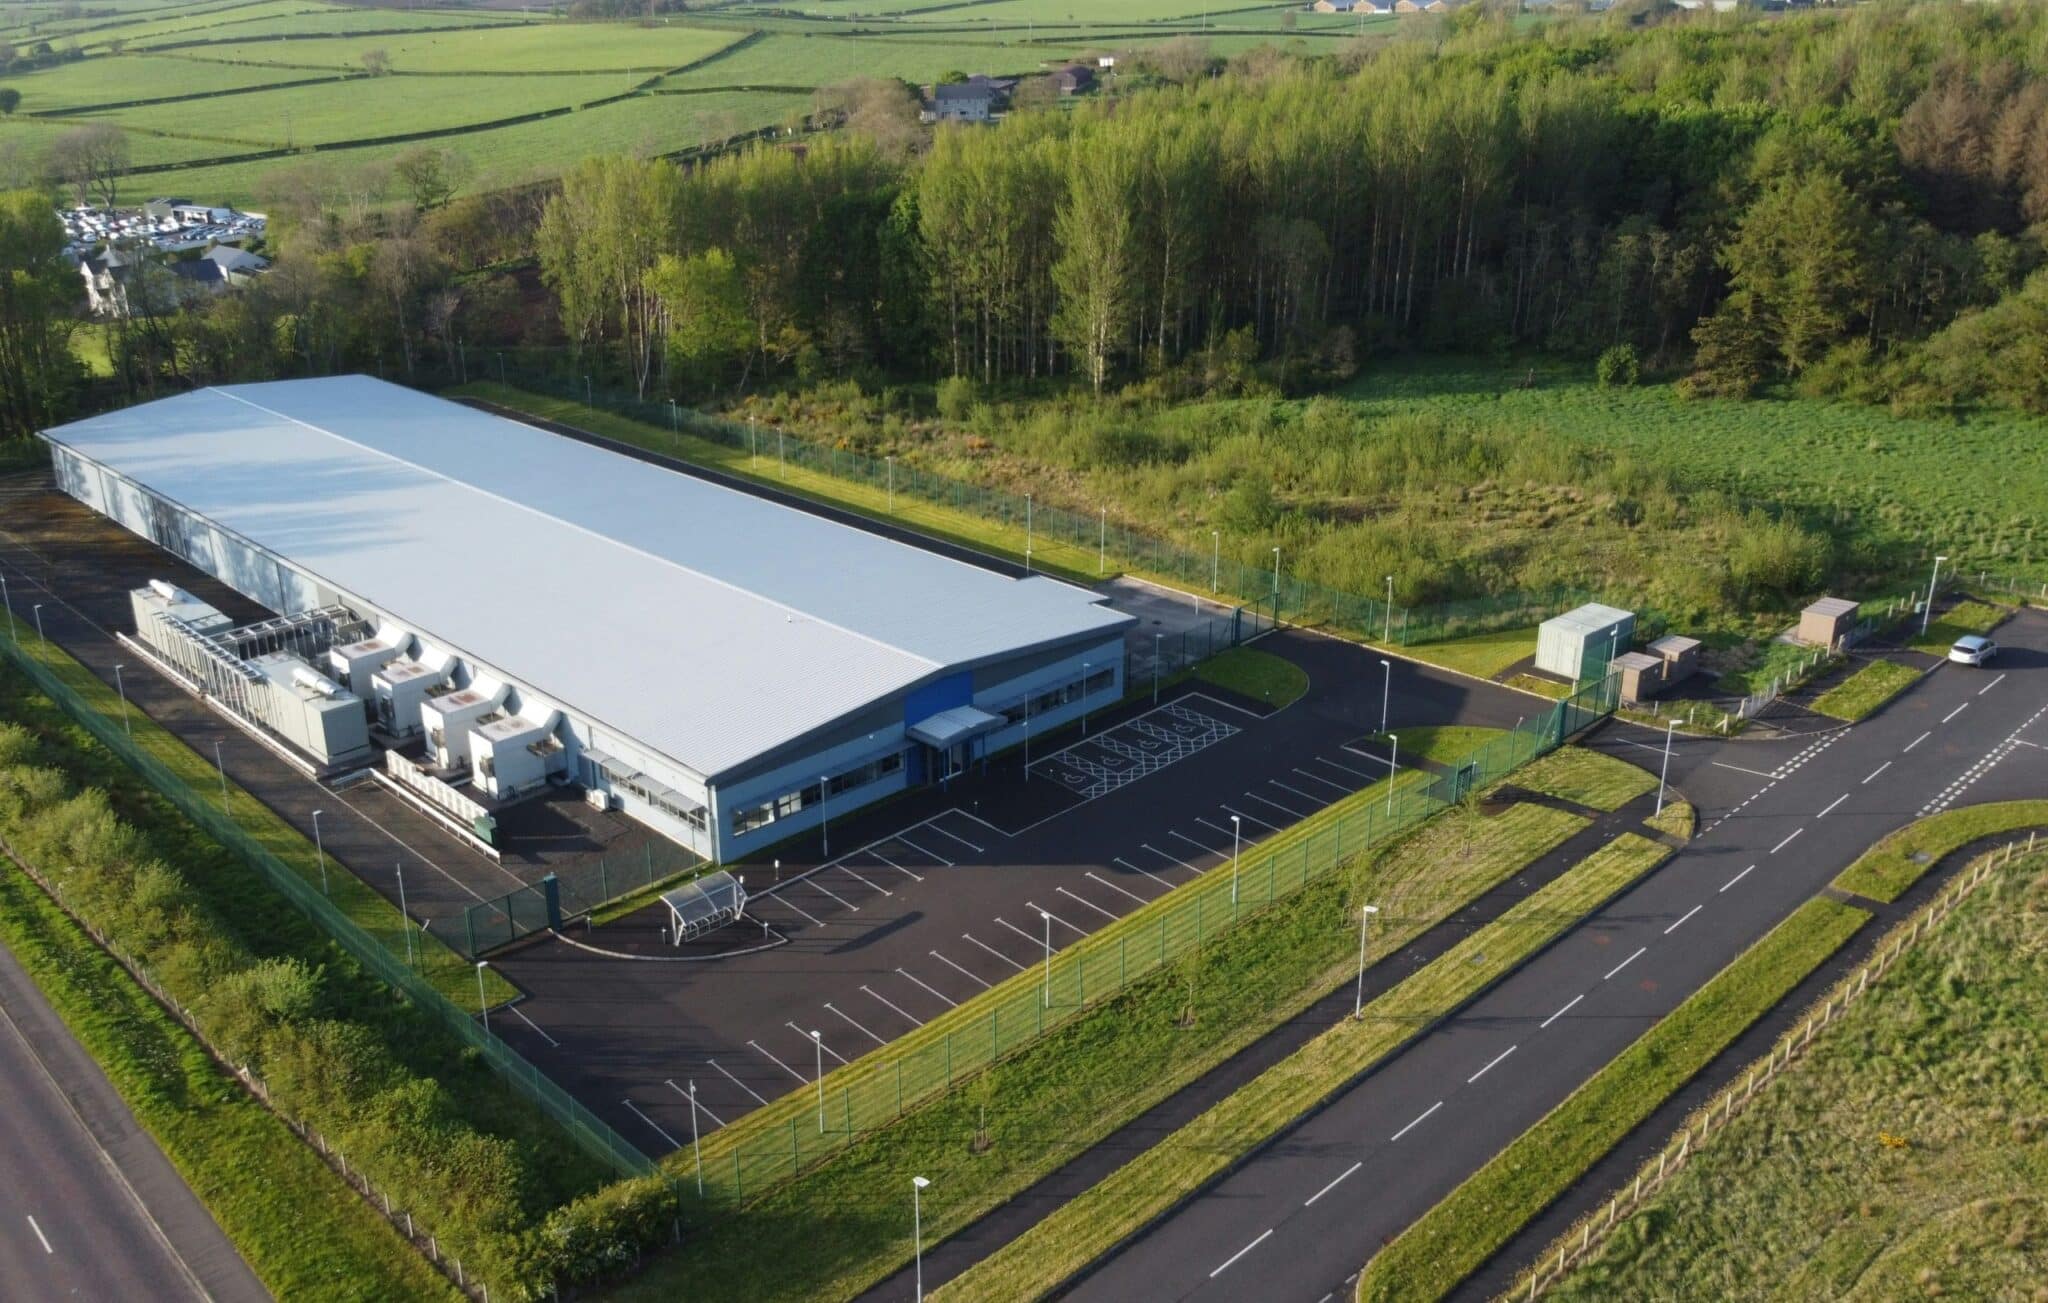
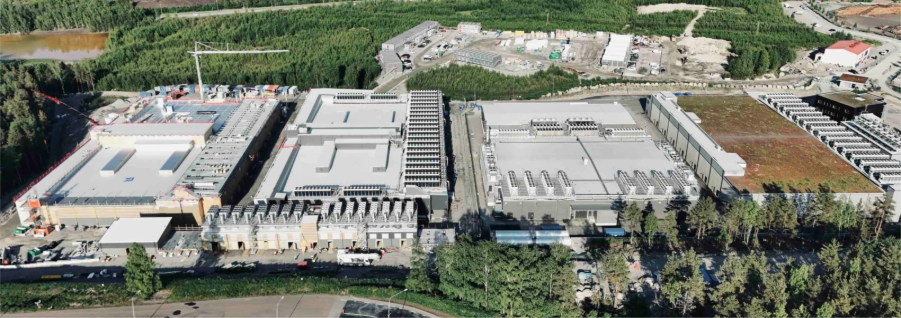
So, what’s the solution? One example of a truly sustainable data center can be found in the EcoDataCenter facility in Falun, Sweden, which boasts the impressive combination of a PUE of 1.2 alongside a WUE of 0.7 (EcoDataCenter Sustainability Report, 2025), less than half of the industry average of 1.8 liters/kWh (Data Center Knowledge, 2025).
It achieves this via a sustainable liquid cooling system that is balanced with natural air cooling, as well as efficiency by design principles in its hardware configurations. Designed for AI workloads with a total capacity of 80 MW, the Falun EcoDataCenter has the same compute capacity as many of the major clouds service providers’ data centers, and yet relies on 100% on-site renewable energy, rather than being powered by the local grid. On top of this, the facility transfers its excess server heat to a local thermal power plant, increasing the local supply of renewable energy.
It achieves this via a sustainable liquid cooling system that is balanced with natural air cooling, as well as efficiency by design principles in its hardware configurations. Designed for AI workloads with a total capacity of 80 MW, the Falun EcoDataCenter has the same compute capacity as many of the major clouds service providers’ data centers, and yet relies on 100% on-site renewable energy, rather than being powered by the local grid. On top of this, the facility transfers its excess server heat to a local thermal power plant, increasing the local supply of renewable energy.
This facility demonstrates the potential that data centers have to not only meet the computing needs of the digital age, but to also contribute to reducing global carbon consumption to help in the fight against climate change.
To build a truly sustainable data center, cloud service providers need to prioritize low PUE, implement a closed-loop water cooling system, draw power directly from 100% renewable energy sources, and find ways of harnessing the inevitable heat they generate. This is an ambitious project that is out of the realm of possibility for many existing data centers due to their existing infrastructure, but it must be prioritized for new builds as the inevitable rollout of new data centers continues.
Find Out More
Tailpipe reduces organizations’ cloud carbon emissions by recommending data centers that are based in low-carbon regions. For a detailed explanation of how Tailpipe can reduce an organization’s cloud spend and carbon emissions, see Tailpipe’s Recommendations.
To discuss what Tailpipe can do to measure and reduce your cloud computing spend and emissions, get in touch with us here.

CameraForensics came to Tailpipe to find out the carbon impact of their cloud-intensive digital imaging platform, used by investigators to solve complex crimes.
Read their blog on our work together below.
Like many businesses, we’re becoming increasingly conscious of the impact we’re having on the environment. And while our primary focus is always going to be on safeguarding children against online crimes, we also want to lessen our impact on the environment as much as possible.
We’re early on in this process, but we’ve recently taken an essential first step: to measure the carbon emissions of our cloud computing, and to create a plan for reducing them. Here’s how we’re doing this with the support of Tailpipe – whose platform can calculate the emissions of cloud computing – and GreenOps consulting partner, DigitalPebble.
Understanding the carbon cost of our cloud computing
We rely on cloud computing heavily here at CameraForensics. It’s what allows us to efficiently process images and data on a huge scale – so that we can develop novel online imaging techniques and digital investigative solutions – without us needing to invest in our own computing infrastructure.
Using Tailpipe, we’ve started to measure how much carbon we generate through these activities. Tailpipe looks at the billing and usage information from our cloud services, primarily hosted with AWS, and estimates the energy used by each, taking into account the type of hardware used. Then, it combines this with data from the location in which those services are running, considering the efficiency of its data centres and the grid mix of the region it’s based in.
Once we got the data from Tailpipe, DigitalPebble provided a useful analysis by breaking down the emissions per service and operations. We were able to calculate our:
Operational emissions – the carbon emissions generated from our day-to-day cloud computing activity.
Embodied emissions – the emissions generated by the entire lifecycle of our cloud computing infrastructure, from manufacturing to shipping and to final disposal.
We learned that each month, we generate the equivalent of 1.3 tonnes of CO2 because of our use of cloud computing. To put this into perspective, this is roughly the same as:
How we plan to reduce our associated emissions
After analysing the data, DigitalPebble recommended three ways that we could start to reduce our cloud computing emissions.
1. Move our cloud operations to less carbon-intensive regions
DigitalPebble advised us that the biggest step we can take to reduce our cloud carbon emissions is to move our cloud operations to a country with a less carbon-intensive grid mix. To put it simply, a country that relies more on renewable energy than coal, oil or gas.
Currently, most of our cloud operations are hosted on servers in the US which has a carbon intensity of 375g CO2eq per kWh on average. This is due to an energy mix consisting mainly of gas and coal. By migrating them to somewhere like the Sweden AWS region, which has an average carbon intensity of about 20g CO2eq, we could reduce our associated carbon footprint to one-twentieth of its current size!
This isn’t going to be an overnight process for us, and there are other factors which will determine where certain infrastructure and data need to be located. However, we have now committed to increasing our use of servers in low-carbon regions, such as Sweden, particularly when deploying the infrastructure needed for our R&D work – which is often carbon-intensive.
2. Use more energy-efficient servers
Using more energy-efficient instance types is another way to reduce how much carbon our cloud computing generates. By using the most appropriate instance types for our activities, we can make sure we’re not using more CPUs or GPUs than needed.
Fortunately, we already have good measures in place to assess utilisation – AWS provides some basic but effective tools to help here – and we also make very good use of cost allocation tags to help us understand what parts of our business are most heavily using cloud resources.
3. Understand our wider environmental impact
DigitalPebble is also helping us to understand how our cloud computing emissions compare to the rest of our emissions. For instance, those we generate by flying internationally.
As we begin our carbon reduction journey, focusing on our cloud computing is the right place for us to start. We have the data and recommendations ready to put into action, and doing so won’t compromise on key aspects of our work – like attending conferences with international law enforcement agencies, for example.
Nevertheless, with this broader understanding of our environmental impact, we’re in a good position to reduce our carbon emissions further in the future.
We’re grateful to Tailpipe and DigitalPebble for supporting us on this journey so far. If you rely on cloud computing like we do, we truly recommend working with them to measure your associated carbon emissions, and get tailored recommendations for reducing them.
Find Out More
For a more detailed breakdown of how Tailpipe calculates emissions, see the Tailpipe Methodology. For an explanation of how Tailpipe can reduce an organization’s cloud spend and carbon emissions, see Tailpipe’s Recommendations.
To discuss what Tailpipe can do to measure and reduce your cloud computing spend and emissions, get in touch with us here.
Data centers are as integral to modern life as running water or electric lights, but we are only just coming to terms with their enormous environmental impacts.
Most of our day-to-day activities now require the use of a data center, from sending emails and messages, attending online meetings, to streaming entertainment, finding your way around using online maps, social media browsing, and online shopping. The side effect of these conveniences has been a massive increase in energy consumption since the dawn of the internet, accompanied by increased carbon emissions, water depletion, and biodiversity loss. Demand for data centers is only increasing with every passing day: data center energy consumption is expected to double by 2030 (IEA, 2025).
It is too late now to go back to the pre-internet age. So, if we cannot stop using data centers, how do we mitigate their impacts on the world we have to live in?
The Environmental Impacts of Data Centers
Emissions
In 2024, data centers consumed 1.5% of global electricity, or 415 billion kWh. With a global grid mix of 473 gCO2e/kWh, that’s almost 200 million tonnes of CO2 – in a single year.
More energy consumption means greater carbon emissions. Data centers generate carbon emissions through their consumption of electricity: every interaction an individual has with the internet sends a request to a data center, which is processed via physical hardware, which draws power. Most data centers draw their power from the local grid, just like homes and businesses. With a global grid mix – the proportion of power generating sources that supply power to a grid – that is still more than 50% reliant on fossil fuels, and the demand for digital services only expanding, data centers are consuming carbon-intensive electricity at an ever-increasing rate.
Water
The average data center consumes 2 million liters of water every day – as much as 6,500 homes.
The electricity that powers the hardware in data centers generates a lot of heat, which causes the hardware to shut down if not effectively dissipated. To resolve this, data centers must be constantly supplied with millions of liters of water, using evaporative cooling to keep the hardware at a constant temperature. This drains local water supplies and contributes to water scarcity in many regions, as unlike residential water consumption, 80% of the water consumed by data centers is evaporated and cannot therefore be recycled back into the local supply.
Biodiversity
The average data center requires 9,000 square meters of land to be concreted over.
Despite increases in hardware efficiency, there is a direct relationship between the demand for digital services and the physical size of data centers: more demand means more servers, which means more floorspace. The number of data centers worldwide is expected to increase by 57% over the next three years, with ambitious construction projects planned in every continent. This reduces the biodiversity of every region in which a data center is constructed, by destroying natural habitats and disrupting local ecosystems.
So, What Can We Do?
Embrace Digital Sobriety
Digital services should be treated no differently from digital devices. It is well recognized that a laptop left idling is a waste of energy, but we rarely apply the same principle to our internet use. We therefore need to transform our approach to digital services, by becoming responsible consumers and designers. As consumers, we should try to limit the number of requests that need to be processed via data centers by simply spending less time on the internet and using fewer energy intensive processes, such as AI or video streaming. As designers, we must promote energy efficiency as a principle of software development.
Migrate to Low-Carbon Data Centers
If we understand the emissions our use of digital services are generating, we are better placed to reduce them. Tailpipe calculates the carbon emissions produced by an organization’s use of cloud services, by assessing the energy consumption of the hardware that hosts the cloud. Tailpipe can then suggest ways of reducing an organization’s cloud emissions, by migrating services to data centers that are connected to energy grids that primarily utilize renewable energy.
To find out more about how to measure and reduce your cloud emissions, get in touch with the Tailpipe team here.
Increase the Efficiency of Data Centers
The energy efficiency of data centers is measured by Power Usage Effectiveness, or PUE. PUE represents the percentage of energy consumed by a data center that is not used by the servers. A score of 1 would represent 100% of the energy being consumed by servers, rather than cooling, lighting, and other overheads. In the 2010s, data center design prioritized energy efficiency to slash the average PUE from 2.5 to 1.5, but that figure has flatlined since 2018. However, because efficiency usually guarantees cost savings, the largest Cloud Service Providers (CSPs) have been pioneering the development of energy efficient data centers in recent years: Amazon Web Service’s (AWS) data centers have an average PUE of 1.15, whilst Google Cloud Platform (GCP) manages 1.09, and Microsoft Azure runs at 1.18. If global data centers can follow this lead, the energy requirements of global data centers will once again drop, reducing emissions in turn.
Similarly, the largest data center operators are tackling the issue of water consumption in their facilities with a range of water efficiency measures. These include new cooling technologies, rainwater harvesting, and the use of wastewater and treated sewage rather than clean water. All the Big Three CSPs (AWS, Azure, and GCP) have committed to becoming ‘water positive’ by 2030, returning more fresh water to the supply than they consume.
Increase Global Renewable Energy Coverage
Even with energy efficiency schemes in place, data centers that use fossil fuel energy will continue to generate carbon emissions in some form. The only way to cut these remaining emissions is for data centers to switch to 100% renewable power sources – or, at least, to increase their utilization of them.
The Big Three CSPs all currently match 100% of their energy consumption from fossil fuels by investing in renewable energy projects around the world. Whilst their investments in renewable energy projects should be commended, energy matching does nothing to decrease the impact of the actual emissions produced when data centers draw power from fossil fuel combustion. To tangibly reduce the emissions of data centers, CSPs must invest in renewable energy infrastructure in the grids they source from or prioritize the development of new data centers in countries with low-carbon grids, such as Brazil, Sweden, and Canada.
The data center industry is one of just three sectors that is projected to increase, rather than decrease, its total emissions into 2030 (IEA, 2025). It is vital that both consumers and providers of digital services respond to this by recognizing the digital world’s environmental impact – and taking action to mitigate and reduce it.
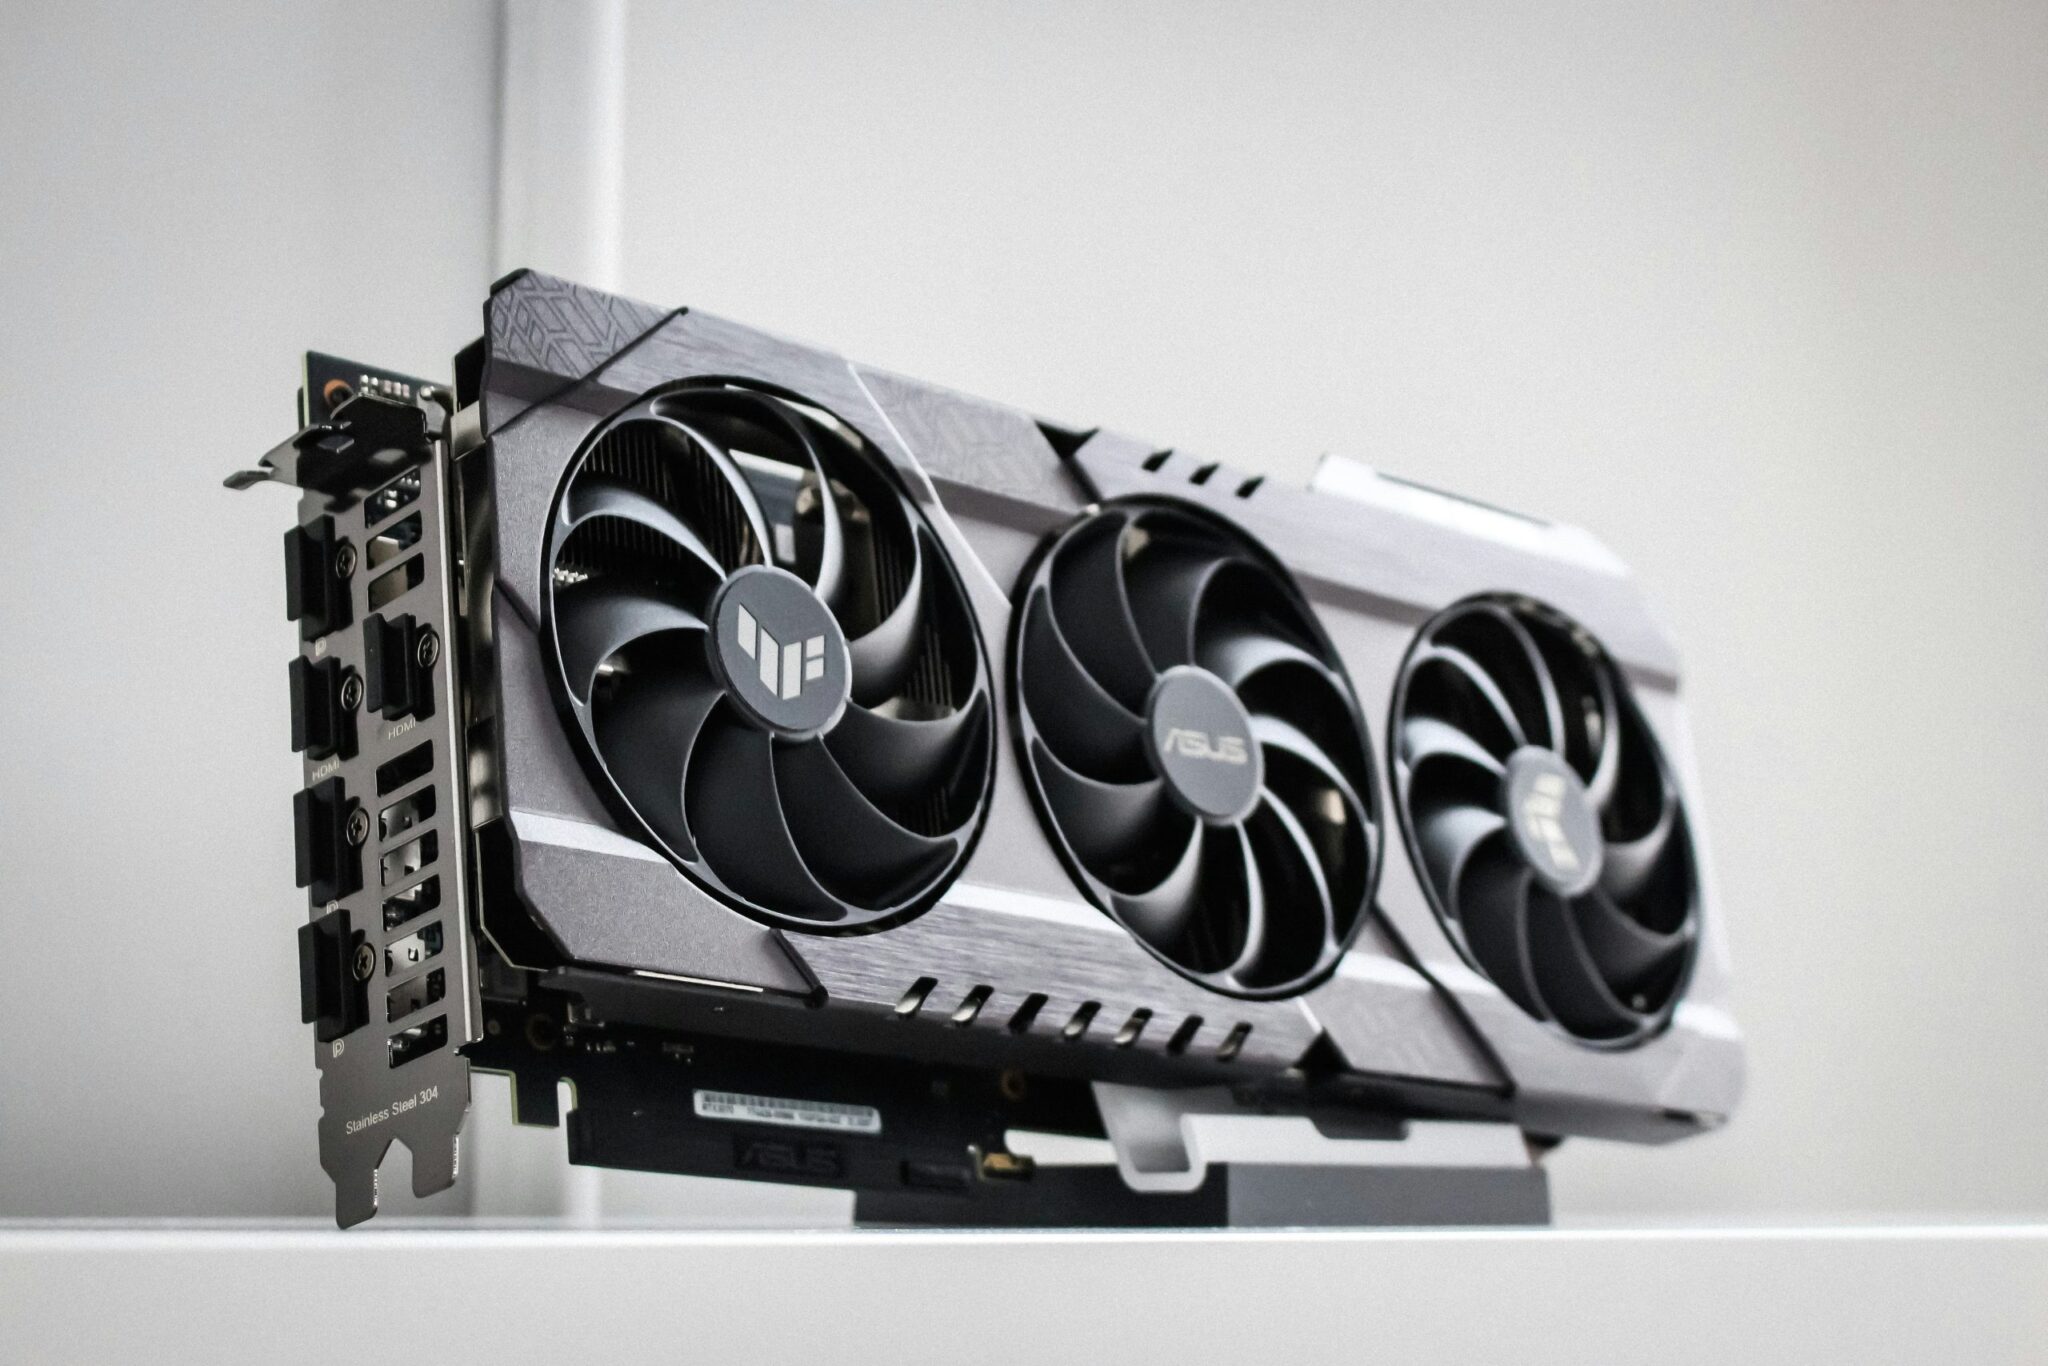
The increasing use of GPUs in cloud computing workloads – and the high energy consumption of these cards – has made accurate measurement of GPU carbon emissions a key aspect of Tailpipe’s methodology for measuring the carbon emissions generated by cloud computing. Tailpipe has built a software for measuring the power draw of GPUs in cloud servers and is delighted to now make the software open source.
It’s important that Tailpipe’s algorithms are as accurate as possible so that organisations can trust the information they receive from Tailpipe and then take the right actions to reduce their cloud computing emissions. As well as carrying out extensive research and using scientific papers and data from computing equipment manufacturers, the Tailpipe team has also been testing servers, measuring the empirical power and comparing those figures with those from Tailpipe’s calculations.
To empirically measure the power draw of servers, Tailpipe utilized the following tools:
In-Line Power Meters – physical boxes that plug into the power supply, before the server plugs into the power meter.
CPU Measurement Software – Teads’ technical team combined Linux applications stress-ng and turbostat to create Turbostress, which can be used to measure the power draw of remote servers using x86 architecture.
GPU Measurement Software – GPU Burn is a multi-GPU CUDA stress tool which, when combined with NVIDIA’s System Management Interface (NVIDIA-SMI), can be used to measure GPU power consumption of remote servers.
However, GPU Burn simply turns the GPU on and off for a specified amount of time, so it’s not helpful for understanding what the power consumption at different levels of GPU utilisation.
So, we decided to create our own software and make it available to everyone. We’ve called it GPU Stress.
GPU Stress is a CUDA-based GPU stress test utility with logging for GPU utilisation, memory usage, and power draw.
When installed and running, it adjusts the GPU power load from 0% to 100% in 5% step increments, each over a 30 second time-period, and then writes the results to a log that can be analysed.
Because you can’t set a precise “run this % GPU utilization” for a GPU, GPU Stress is written so that the average GPU utilization over the 30 second time-period aims to be as close to the relevant target GPU utilization step.
An example set of results from running on an AWS g4dn.xlarge is:

Find Out More
For a more detailed breakdown of how Tailpipe calculates emissions, see the Tailpipe Methodology. For an explanation of how Tailpipe can reduce an organization’s cloud spend and carbon emissions, see Tailpipe’s Recommendations.
To discuss what Tailpipe can do to measure and reduce your cloud computing spend and emissions, get in touch with us here.

In 2020, all the data centers in the world used less than 300 TWh of electricity, or 1% of global energy consumption (MIT, 2025). In 2024, they consumed 415 TWh, reaching 1.5%. By 2030, they are expected to consume 945 TWh – that’s 3% of global electricity consumption (IEA, 2025), and more than the entire aviation industry (IEA, 2025). Why? Because the exponential growth in AI development and usage is more power-hungry than any computing process to come before it.
As the internet becomes increasingly over-saturated with AI content, we must consider: is the environmental cost worth the output?
The Impact of AI on Energy Consumption
Any request using the internet, whether for AI, search engines, web hosting, emails, or streaming, requires energy. The servers that process these requests are housed in data centers powered by electricity. In most countries, this electricity is drawn from fossil fuel powered energy grids, resulting in the release of carbon emissions.
The biggest driver of the increase in data center energy consumption in the past five years has been AI. An AI request today requires almost ten times more electricity than a search engine request (IEA, 2024):
Google search – 0.3 Wh
ChatGPT request – 3 Wh
If AI does drive data center energy consumption to 945 TWh, 2030 will see data center emissions reach 447 million tonnes of CO2e (based on a global grid mix of 473 gCO2e/kWh (Ember, 2024)). To keep global temperatures below the 1.5°C threshold agreed in the Paris Agreement, the world has just 160 billion tonnes of CO2 left to burn through. 447 million tonnes represent 0.3% of that budget – almost as much as the entire population of Brazil emits every year (Our World in Data, 2023).
Why Does it Matter?
As the use of AI skyrockets and associated emissions climb, the internet is becoming ever more saturated with AI content – and this is laying the foundations of a total AI model collapse. In this scenario, the millions of tonnes of CO2 that have (and are yet to be) released into the atmosphere thanks to AI will have been for nothing.
AI model collapse takes place when AI models consume AI-generated content during model training. With more than half of the text on the internet already being AI generated or translated (AWS & UC Santa Barbara, 2024), AI models are currently being trained on a vast pool of non-human content. AI models that are trained on AI content produce poor-quality outputs that become nonsensical after a few iterations of training (Nature, 2024). For example, in this study, when asked about historic church architecture, the first iteration model confused the 18th and 19th centuries, the second iteration hallucinated the existence of a St Peter’s Basilica in Buenos Aires, the sixth iteration responded with nothing but a list of languages, and the tenth iteration answered:
‘In addition to being home to some of the world’s largest populations of black tailed jackrabbits, white tailed jackrabbits, blue tailed jackrabbits, red tailed jackrabbits, yellow.’
Without fresh human-generated training data, or a fundamental change in the way AI works, AI models will continuously degrade. If current trends continue, the 447 million tonnes of CO2e generated by data centers in 2030 could be fuelling an ever more unusable pool of AI generated content.
What Can We Do About It?
Educate individuals about the energy consumption of AI.
The most important first step is for individuals to become aware of how energy intensive AI can be. Most people are unaware that AI – much like search engine queries – even has a carbon impact. In particular, organizations that have adopted AI have a responsibility to educate their employees on the environmental impact of its use.
By quantifying how much energy AI uses in relatable terms, individuals can better weigh up when it is worth using. For example, the 3 Wh of energy needed for a ChatGPT request is about the same as charging a phone to 100% (EnergySage, 2024).
Be selective about how AI is used.
The next step is to consider the most efficient use cases for AI. AI-enhanced processes can be more productive and less energy intensive than a person working alone, usually by cutting down the time it takes for an individual to process information. On the flip side, mandatory AI processes can generate emissions unnecessarily. For example, customer service chatbots that cannot be bypassed when a customer requires input from a real agent, or AI generated content that requires human assessment and editing.
AI tools should be implemented only when their use is shown to be more effective and less energy intensive than an employee working alone.
Consider where your energy is coming from.
One of the most proactive things an organization can do to reduce the carbon emissions of its AI usage is to locate the infrastructure on which it runs, whether owned by the organization or operating in the cloud, in a data center in a location where the electricity used has a low carbon intensity. In most cases, organizations can request that their services are based in specific data centers, with a manageable impact on operationality or cost.
Because data centers are connected to the national grid of the country they are in, the carbon intensity of that country’s or that region’s grid will determine how much carbon the computing processes within that data center produce. For example, cloud services operating through a Norwegian data center will generate far fewer emissions than the same services based in data center on the East Coast of the US, because Norway’s national grid is powered by a much higher percentage of renewable energy sources than that on the US East Coast.
Currently, 45% of the world’s data center capacity belongs to the US, followed by China (MIT, 2025). Unfortunately, these two countries have very carbon intensive grid mixes, with gas being the primary energy source in the US, and coal in China. To stay below the 1.5°C threshold, every country must entirely decarbonize their grids by 2050. Fortunately, many European and South American nations are investing heavily in data center construction, building upon continental grids that are primarily powered by renewables. This is opening up opportunities for organizations to lower their AI emissions by requesting that their cloud services be located in either continent.
Find Out More
If you’re concerned about the impact of AI on your organization’s carbon emissions and would like to quantify and reduce your impact, get in touch with the Tailpipe team here.

We’ve built Tailpipe to make it easy for organizations to measure and reduce the carbon emissions of their cloud computing workloads. Now, with the Tailpipe API, you can bring that same visibility and intelligence directly into your own tools, dashboards, and workflows.
Whether you’re tracking emissions across AWS accounts, integrating with internal reporting systems, or building your own sustainability analytics, the Tailpipe API gives you programmatic access to all the core data: emissions by cloud service, time period, region, and more.
With the Tailpipe API, you can:
Get Started
Explore the full API reference at https://tailpipe.apidocumentation.com/reference – complete with request examples, authentication details, and response formats.
Tailpipe is built for teams that care about both performance and planet. The API makes it easier than ever to embed that ethos into everything you build.
If you’re interested in reducing your cloud computing carbon emissions, get in touch with us here.

How Tailpipe and Common Crawl are Tracking and Reducing Web Crawl Carbon Emissions
At the start of 2025, Tailpipe and Common Crawl teamed up to measure the carbon emissions generated by Common Crawl’s frequent internet-wide web crawl. Common Crawl conducts monthly crawls of the web, adding 3 to 5 billion pages of text to their open-source repository with every crawl. With such a vast quantity of data processing taking place every month, Common Crawl were keen to understand the real-world emissions implications of their crawls.
In collaboration with GreenOps and FinOps consultancy, DigitalPebble, Tailpipe assessed Common Crawl’s AWS usage data for the months of February and March. Tailpipe calculated how many Watts of power Common Crawl’s processes consumed, and the quantity of carbon emissions this power consumption generated. With this information, Common Crawl is equipped to reduce its carbon emissions by identifying areas of over consumption. Our collaboration revealed a fascinating relationship between the different stages of the crawl process and the amount of carbon being emitted.
How Does a Web Crawl Generate Carbon?
Every request in a web crawl is routed through a server in a data center. These servers require electricity, which is drawn from the data center’s local energy grid. If that grid is reliant on fossil fuels as its energy source, every watt of power consumed by the server will require the combustion of fuel, releasing carbon and other greenhouse gases into the atmosphere.
In Common Crawl’s case, most of the servers that their cloud computing is hosted on are based in AWS data centers in North Virginia. The US in this region is primarily reliant on fossil fuels, sourcing 60% of its energy from oil and coal. This means that for every kilowatt-hour of energy that Common Crawl required, 0.39 kilograms of CO2 were released.
How Common Crawl Crawls the Web
First, Common Crawl carries out a ‘seed crawl’, to collect the URLs from which it will launch its web-wide crawl. During the crawl, the crawler scans these URLs for links to other pages and so explores every available page recursively. Web ARChive (WARC) files are created, which store this data. In the final phase, WET (WARC Encapsulated Text) and WAT (WARC Timestamp) files are generated, which store the pages’ text and metadata respectively.
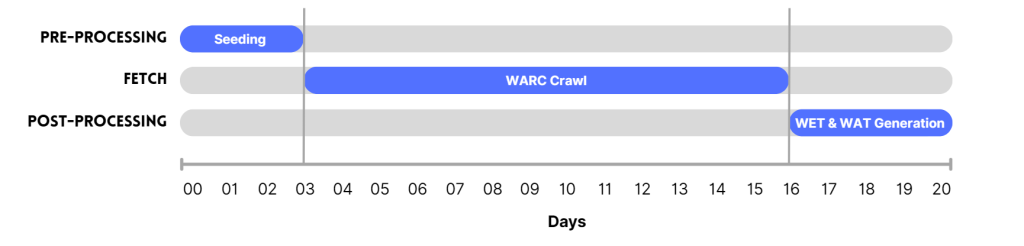
The phases of a Common Crawl web crawl across 20 days.
Findings
From the 1st to the 31st of March, Common Crawl’s use of cloud computing generated 326.4 kgCO2e. That’s the same as driving 1,194 miles in a petrol car.
Of this, 319.5 kilograms were caused by the power draw needed to keep servers responding to Common Crawl’s requests. 6.9 kilograms were ‘embodied’, which means that these emissions were generated during the manufacture of the hardware.
Additionally, Tailpipe identified that 52.5% of Common Crawl’s emissions were due to the power consumption of storage servers (171.4 kgCO2e). The rest was generated by compute requests.
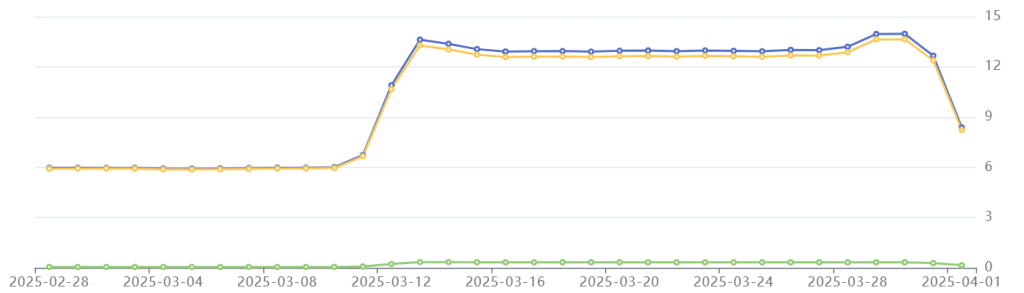
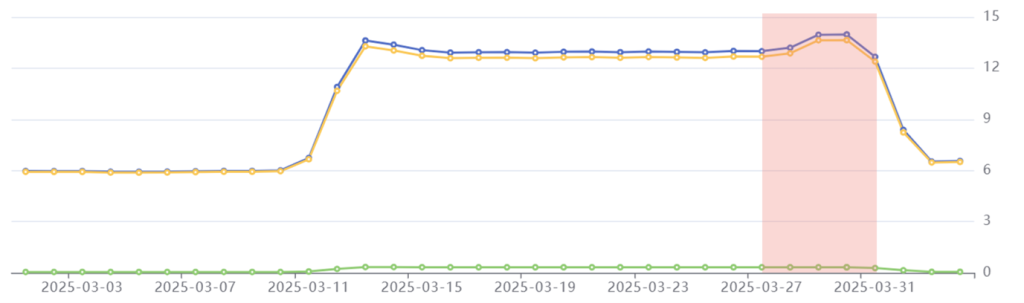
Tailpipe’s emissions data for Common Crawl in March 2025: Total emissions in blue, operational emissions in yellow, embodied emissions in green. Emissions on the right-hand axis are in kilograms of CO2e per day.
Common Crawl’s web crawl takes place across three phases, which can be identified in Tailpipe’s emissions data. The pre-processing phase lasted from the 11th to the 15th of March and caused a spike in power consumption resulting in increased emissions. The fetch phase, from the 15th to the 28th of March, saw emissions stabilize. Finally, the post-processing phase required a small increase in power that heightened emissions for a short period, before dropping off as the crawl concluded.
Overall, Common Crawl’s daily emissions more than double during the 21-day crawl, compared to their non-crawling state.
Phase 1: Pre-Processing
Period: March 11th-14th
Emissions: 44.6 kgCO2e
Phenomenon: A spike in emissions that more than doubles the daily carbon emissions.
Common Crawl started their crawl process on March 11th, with the pre-processing phase. This involves a seed crawl, which collects the URLs that the crawler will use to process each site. It takes around three days to complete the seed crawl.
In this period, we see Common Crawl’s emissions suddenly spike. This is because a huge quantity of compute power is needed to source those URLs, which requires a surge of electrical power to the cloud servers.
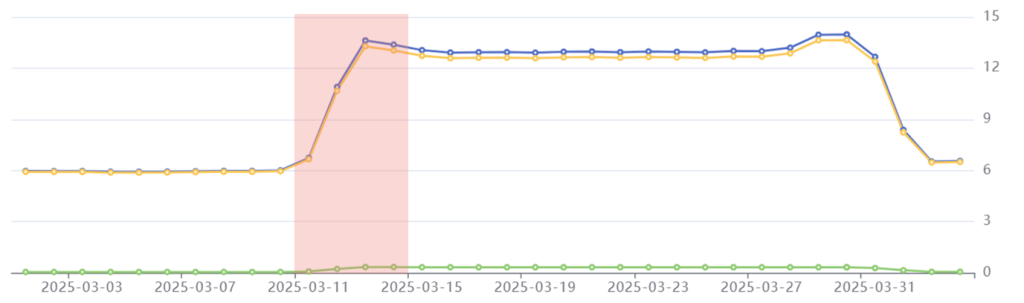
Pre-processing phase highlighted in red: Common Crawl’s daily emissions more than double from 6 kgCO2e to 13.4 kgCO2e.
Phase 2: Fetch
Period: March 15th-28th
Emissions: 168.5 kgCO2e
Phenomenon: Emissions stabilize for the duration of the crawl.
On March 15th, Common Crawl started crawling their seed URLs. This involves scanning each URL page for hyperlinks, which are saved and then scanned themselves. The crawled data is stored in a WARC (Web ARChive) format. With up to five billion pages to crawl, this requires a high level of processor utilization that must be fed by a constant power supply. Emissions in this period are therefore maintained at a relatively high level.
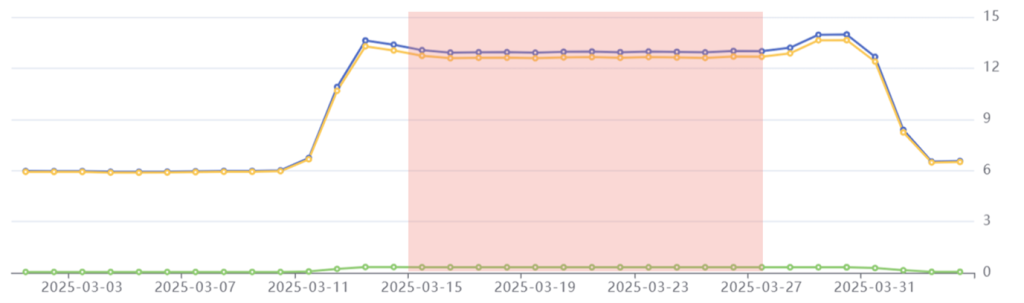
Fetch phase highlighted in red: Common Crawl’s emissions stabilize at 13 kgCO2e per day.
Phase 3: Post-Processing
Period: March 28th-31st
Emissions: 53.8 kgCO2e
Phenomenon: Emissions peak slightly before beginning to decrease to pre-crawl level.
In the final phase of the crawl, Common Crawl generates its WET and WAT files. WET files store the plain text embedded in each page, whilst WAT files store every page’s metadata. This requires a small boost of compute and storage capacity for the virtual machines processing the crawl, drawing more power than the fetch phase and resulting in peak emissions of 14 kgCO2e per day.
Once the crawler has made its way through most of the WET and WAT files, the power draw decreases, and emissions start to decline.
Post-processing phase highlighted in red: Common Crawl’s emissions peak at 14 kgCO2e before beginning to decline.
Interestingly, during the post-processing phase, AWS billed Common Crawl less per day, despite emissions (and therefore utilization) increasing. This suggests that Common Crawl’s workload was being consolidated across fewer computing instances with a higher utilization rate than during the fetch phase – we see embodied emissions drop here too, as less physical hardware is provisioned. This demonstrates the importance of efficient resource provisioning, which can bring down costs for an organization.
Before and After the Crawl
For the first ten days of every month, Common Crawl’s emissions stabilize at an average of 6 kgCO2e per day.
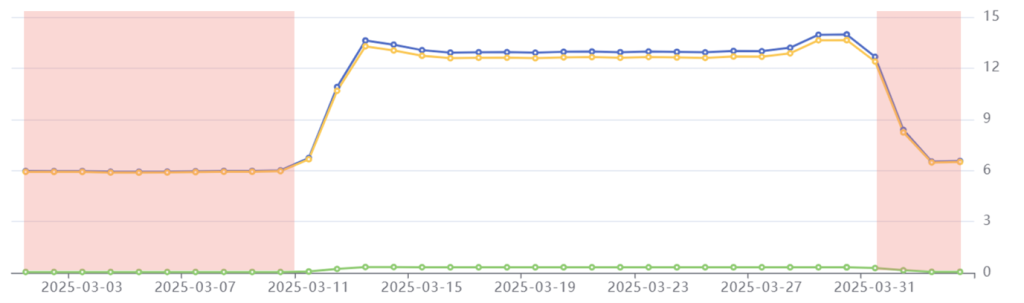
Pre-crawl phase highlighted in red: Common Crawl’s day to day use of cloud services generates 6 kgCO2e per day.
These emissions result from the power consumption of servers that are hosting Common Crawl’s Index Server, as well as the everyday background activities of Common Crawl’s developers. Tailpipe’s data shows that Common Crawl’s crawl demands more than twice as much power as the non-crawl operations of its cloud services – therefore generating double the quantity of carbon emissions.
What Common Crawl is Doing to Keep Emissions Low
Despite the sheer enormity of the task that Common Crawl carries out every month, its total emissions – 326.4 kgCO2e – are very low for the scale of its operation. Common Crawl’s low emissions are a result of the cloud services they use being selected with efficiency in mind, and their utilization of the most recent and energy efficient hardware.
As an open-source dataset, Common Crawl also eliminates the need for public or private enterprises and individuals to carry out their own crawls. This means that those 326.4 kgCO2e never have to be generated more than once a month.
Due to the open-source nature of Common Crawl’s dataset, they are subject to copyright restrictions that limit the location of their cloud services to US-based data centers. If they were not subject to these limitations, Tailpipe and DigitalPebble identified that Common Crawl could cut emissions by 90% through migrating their cloud services to a data center that is connected to a lower carbon grid. For example, a Kilowatt Hour of energy consumed by a data center in Sweden produces just 0.02 kgCO2e, compared to the US’ 0.39 kgCO2e. In fact, Common Crawl does utilize a single S3 bucket in a French datacenter already, which generates far lower emissions (0.04 kgCO2e/kWh) than other S3 buckets in the US.
Nonetheless, Common Crawl manages to crawl five billion web pages at a carbon cost of just 326.4 kgCO2e. By providing its data for free, Common Crawl successfully delivers a world-class repository of web data whilst limiting the impact of the internet on the planet.
Find Out More
For a more detailed breakdown of how Tailpipe calculates emissions, see the Tailpipe Methodology. For an explanation of how Tailpipe can reduce an organization’s cloud spend and carbon emissions, see Tailpipe’s Recommendations.
To discuss what Tailpipe can do to measure and reduce your cloud computing spend and emissions, get in touch with us here.
We use cookies to improve your experience on our site. By using our site, you consent to cookies.
Websites store cookies to enhance functionality and personalise your experience. You can manage your preferences, but blocking some cookies may impact site performance and services.
Essential cookies enable basic functions and are necessary for the proper function of the website.
Google reCAPTCHA helps protect websites from spam and abuse by verifying user interactions through challenges.
Statistics cookies collect information anonymously. This information helps us understand how visitors use our website.
Google Analytics is a powerful tool that tracks and analyzes website traffic for informed marketing decisions.
Service URL: policies.google.com (opens in a new window)
You can find more information in our Cookie Policy and Privacy Policy.