How Tailpipe and Common Crawl are Tracking and Reducing Web Crawl Carbon Emissions
At the start of 2025, Tailpipe and Common Crawl teamed up to measure the carbon emissions generated by Common Crawl’s frequent internet-wide web crawl. Common Crawl conducts monthly crawls of the web, adding 3 to 5 billion pages of text to their open-source repository with every crawl. With such a vast quantity of data processing taking place every month, Common Crawl were keen to understand the real-world emissions implications of their crawls.
In collaboration with GreenOps and FinOps consultancy, DigitalPebble, Tailpipe assessed Common Crawl’s AWS usage data for the months of February and March. Tailpipe calculated how many Watts of power Common Crawl’s processes consumed, and the quantity of carbon emissions this power consumption generated. With this information, Common Crawl is equipped to reduce its carbon emissions by identifying areas of over consumption. Our collaboration revealed a fascinating relationship between the different stages of the crawl process and the amount of carbon being emitted.
How Does a Web Crawl Generate Carbon?
Every request in a web crawl is routed through a server in a data center. These servers require electricity, which is drawn from the data center’s local energy grid. If that grid is reliant on fossil fuels as its energy source, every watt of power consumed by the server will require the combustion of fuel, releasing carbon and other greenhouse gases into the atmosphere.
In Common Crawl’s case, most of the servers that their cloud computing is hosted on are based in AWS data centers in North Virginia. The US in this region is primarily reliant on fossil fuels, sourcing 60% of its energy from oil and coal. This means that for every kilowatt-hour of energy that Common Crawl required, 0.39 kilograms of CO2 were released.
How Common Crawl Crawls the Web
First, Common Crawl carries out a ‘seed crawl’, to collect the URLs from which it will launch its web-wide crawl. During the crawl, the crawler scans these URLs for links to other pages and so explores every available page recursively. Web ARChive (WARC) files are created, which store this data. In the final phase, WET (WARC Encapsulated Text) and WAT (WARC Timestamp) files are generated, which store the pages’ text and metadata respectively.
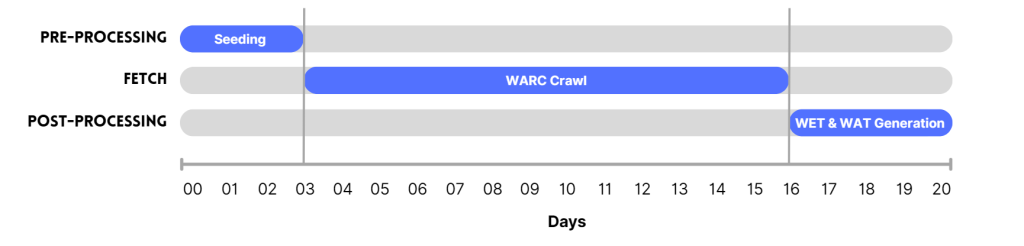
The phases of a Common Crawl web crawl across 20 days.
Findings
From the 1st to the 31st of March, Common Crawl’s use of cloud computing generated 326.4 kgCO2e. That’s the same as driving 1,194 miles in a petrol car.
Of this, 319.5 kilograms were caused by the power draw needed to keep servers responding to Common Crawl’s requests. 6.9 kilograms were ‘embodied’, which means that these emissions were generated during the manufacture of the hardware.
Additionally, Tailpipe identified that 52.5% of Common Crawl’s emissions were due to the power consumption of storage servers (171.4 kgCO2e). The rest was generated by compute requests.
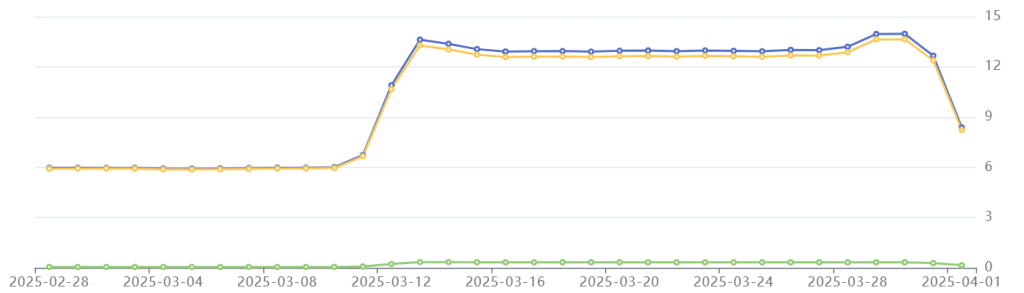
Tailpipe’s emissions data for Common Crawl in March 2025: Total emissions in blue, operational emissions in yellow, embodied emissions in green. Emissions on the right-hand axis are in kilograms of CO2e per day.
Common Crawl’s web crawl takes place across three phases, which can be identified in Tailpipe’s emissions data. The pre-processing phase lasted from the 11th to the 15th of March and caused a spike in power consumption resulting in increased emissions. The fetch phase, from the 15th to the 28th of March, saw emissions stabilize. Finally, the post-processing phase required a small increase in power that heightened emissions for a short period, before dropping off as the crawl concluded.
Overall, Common Crawl’s daily emissions more than double during the 21-day crawl, compared to their non-crawling state.
Phase 1: Pre-Processing
Period: March 11th-14th
Emissions: 44.6 kgCO2e
Phenomenon: A spike in emissions that more than doubles the daily carbon emissions.
Common Crawl started their crawl process on March 11th, with the pre-processing phase. This involves a seed crawl, which collects the URLs that the crawler will use to process each site. It takes around three days to complete the seed crawl.
In this period, we see Common Crawl’s emissions suddenly spike. This is because a huge quantity of compute power is needed to source those URLs, which requires a surge of electrical power to the cloud servers.
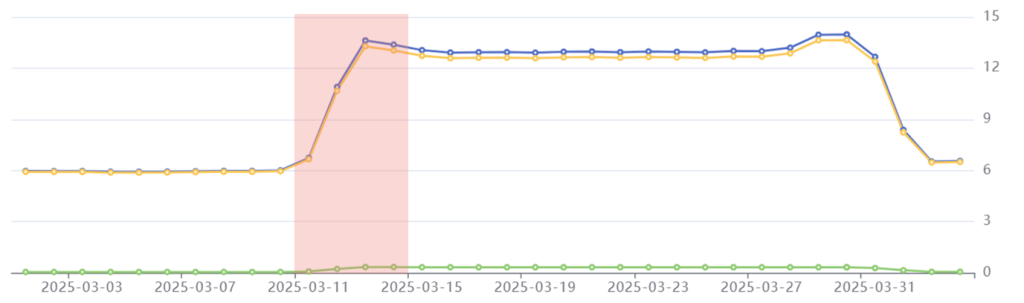
Pre-processing phase highlighted in red: Common Crawl’s daily emissions more than double from 6 kgCO2e to 13.4 kgCO2e.
Phase 2: Fetch
Period: March 15th-28th
Emissions: 168.5 kgCO2e
Phenomenon: Emissions stabilize for the duration of the crawl.
On March 15th, Common Crawl started crawling their seed URLs. This involves scanning each URL page for hyperlinks, which are saved and then scanned themselves. The crawled data is stored in a WARC (Web ARChive) format. With up to five billion pages to crawl, this requires a high level of processor utilization that must be fed by a constant power supply. Emissions in this period are therefore maintained at a relatively high level.
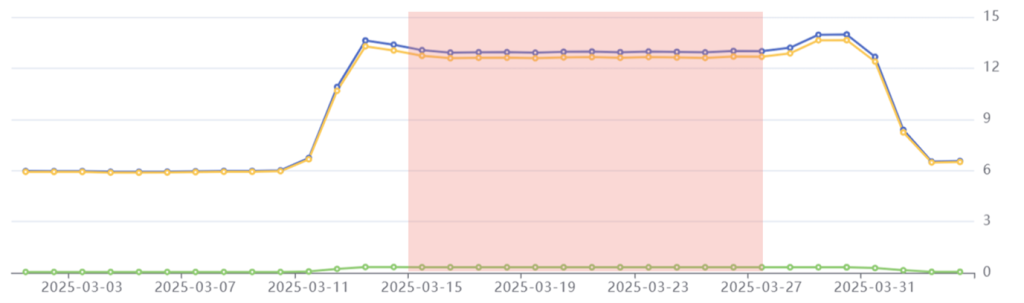
Fetch phase highlighted in red: Common Crawl’s emissions stabilize at 13 kgCO2e per day.
Phase 3: Post-Processing
Period: March 28th-31st
Emissions: 53.8 kgCO2e
Phenomenon: Emissions peak slightly before beginning to decrease to pre-crawl level.
In the final phase of the crawl, Common Crawl generates its WET and WAT files. WET files store the plain text embedded in each page, whilst WAT files store every page’s metadata. This requires a small boost of compute and storage capacity for the virtual machines processing the crawl, drawing more power than the fetch phase and resulting in peak emissions of 14 kgCO2e per day.
Once the crawler has made its way through most of the WET and WAT files, the power draw decreases, and emissions start to decline.
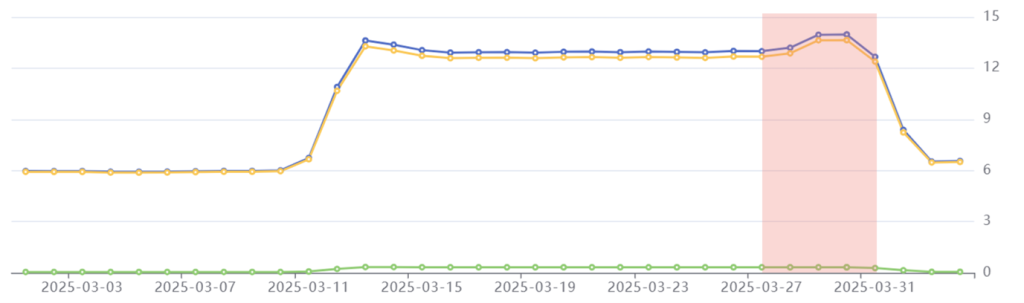
Post-processing phase highlighted in red: Common Crawl’s emissions peak at 14 kgCO2e before beginning to decline.
Interestingly, during the post-processing phase, AWS billed Common Crawl less per day, despite emissions (and therefore utilization) increasing. This suggests that Common Crawl’s workload was being consolidated across fewer computing instances with a higher utilization rate than during the fetch phase – we see embodied emissions drop here too, as less physical hardware is provisioned. This demonstrates the importance of efficient resource provisioning, which can bring down costs for an organization.
Before and After the Crawl
For the first ten days of every month, Common Crawl’s emissions stabilize at an average of 6 kgCO2e per day.
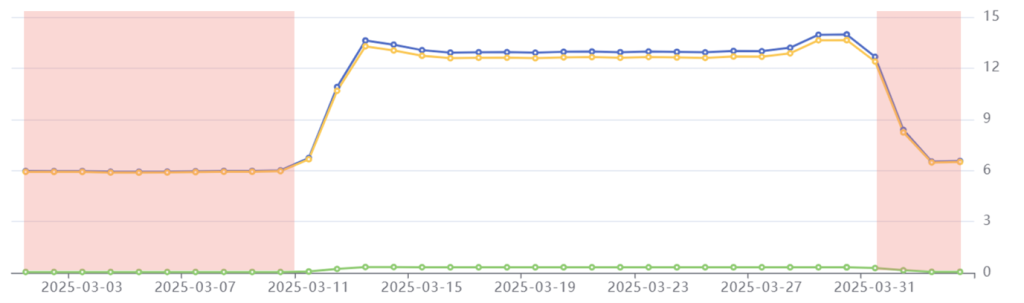
Pre-crawl phase highlighted in red: Common Crawl’s day to day use of cloud services generates 6 kgCO2e per day.
These emissions result from the power consumption of servers that are hosting Common Crawl’s Index Server, as well as the everyday background activities of Common Crawl’s developers. Tailpipe’s data shows that Common Crawl’s crawl demands more than twice as much power as the non-crawl operations of its cloud services – therefore generating double the quantity of carbon emissions.
What Common Crawl is Doing to Keep Emissions Low
Despite the sheer enormity of the task that Common Crawl carries out every month, its total emissions – 326.4 kgCO2e – are very low for the scale of its operation. Common Crawl’s low emissions are a result of the cloud services they use being selected with efficiency in mind, and their utilization of the most recent and energy efficient hardware.
As an open-source dataset, Common Crawl also eliminates the need for public or private enterprises and individuals to carry out their own crawls. This means that those 326.4 kgCO2e never have to be generated more than once a month.
Due to the open-source nature of Common Crawl’s dataset, they are subject to copyright restrictions that limit the location of their cloud services to US-based data centers. If they were not subject to these limitations, Tailpipe and DigitalPebble identified that Common Crawl could cut emissions by 90% through migrating their cloud services to a data center that is connected to a lower carbon grid. For example, a Kilowatt Hour of energy consumed by a data center in Sweden produces just 0.02 kgCO2e, compared to the US’ 0.39 kgCO2e. In fact, Common Crawl does utilize a single S3 bucket in a French datacenter already, which generates far lower emissions (0.04 kgCO2e/kWh) than other S3 buckets in the US.
Nonetheless, Common Crawl manages to crawl five billion web pages at a carbon cost of just 326.4 kgCO2e. By providing its data for free, Common Crawl successfully delivers a world-class repository of web data whilst limiting the impact of the internet on the planet.
Find Out More
For a more detailed breakdown of how Tailpipe calculates emissions, see the Tailpipe Methodology. For an explanation of how Tailpipe can reduce an organization’s cloud spend and carbon emissions, see Tailpipe’s Recommendations.
To discuss what Tailpipe can do to measure and reduce your cloud computing spend and emissions, get in touch with us here.
We use cookies to improve your experience on our site. By using our site, you consent to cookies.
Websites store cookies to enhance functionality and personalise your experience. You can manage your preferences, but blocking some cookies may impact site performance and services.
Essential cookies enable basic functions and are necessary for the proper function of the website.
Google reCAPTCHA helps protect websites from spam and abuse by verifying user interactions through challenges.
Statistics cookies collect information anonymously. This information helps us understand how visitors use our website.
Google Analytics is a powerful tool that tracks and analyzes website traffic for informed marketing decisions.
Service URL: policies.google.com (opens in a new window)
You can find more information in our Cookie Policy and Privacy Policy.