How does an organization go about calculating the CO2e emissions from their use of cloud computing?
Organizations are facing increasing pressure to report their Scope 3 emissions. For any company that purchases cloud computing services, this includes the carbon emissions of their cloud usage. With the EU leading the way in mandating Scope 3 reporting with the Corporate Sustainability Reporting Directive, and countries around the world following suit by beginning to adopt the IFRS S2 standard, organizations of all sizes, from all industries, are faced with the task of accounting for their full carbon impact.
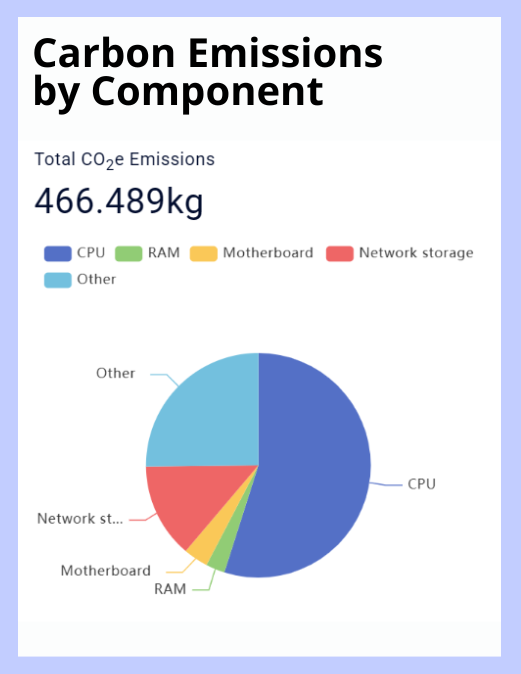
However, until now, the carbon impact of the cloud has been under examined, and sustainability leaders are left to choose between wildly unreliable spend-based factors, or Cloud Service Provider (CSP) estimators with opaque methodologies and a vested interest in reporting low emissions. Instead, organizations like Boavizta and Tailpipe propose a new, usage-based methodology to make cloud carbon reporting simple and accessible. Tailpipe assessed its own carbon emissions from its cloud use from November 2024 to November 2025, resulting in a figure of 466.49 kgCO2e. It is this figure that will now be examined and compared to those generated by spend-based factors, and CSP estimations.
How Does the Cloud Generate Emissions?
Cloud computing generates carbon emissions from the energy consumption of computing equipment inside data centers. Every request to the cloud is routed to a server in a data center somewhere in the world. These servers require a constant feed of power, which increases with utilization – the level of intensity at which the computing equipment is working. Data centers therefore draw a vast amount of power from local energy grids, and when those local energy grids are predominantly powered by fossil fuels, it makes them responsible for the subsequent release of CO2e into the atmosphere.
Spend-based Factors: How does my cloud spend correlate to carbon?
In short, with cloud computing, spend does not correlate to carbon emissions. Most estimations of cloud emissions currently being reported are based on spend-based factors, as provided by the USEEIO, OpenCEDA, and EXIOBASE. These databases are ‘environmentally extended input-output’ models, which calculate CO2e per dollar spent by dividing an estimation for the total input spend on an industry by its total output emissions. These factors are fundamentally unfit for purpose when it comes to cloud carbon, overestimating emissions against a usage-based model by up to a factor of almost ten, as the following table shows for Tailpipe’s spend and usage of cloud computing for 12 months from November 2024 to November 2025:
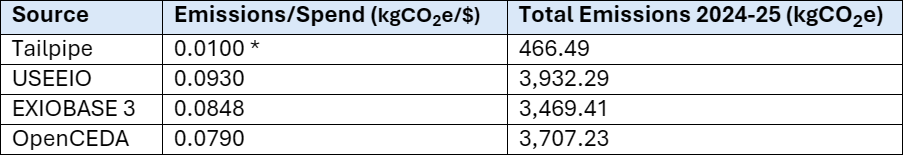
Spend-based emissions factors fundamentally misrepresent the relationship between the usage of cloud computing and carbon emissions. There is no direct correlation between cloud spend and emissions: instead, the relationship is between cloud utilization and emissions. It is actually possible for carbon to increase when spend drops, and vice versa. For example, an organization might condense their cloud workload from a high number of underutilised virtual machines to a lower number of highly utilised virtual machines, in which case their spend would decrease – whilst power draw, and therefore carbon emissions, will increase. Similarly, no two cloud workloads are the same: Company A and Company B might be paying the same amount to host their website in the cloud, but whilst Company A processes hundreds of visitors an hour, Company B has just a handful.
Additionally, despite being separate databases, these three models are calculated based on the same economic input and carbon output datasets, which date from between 2007 and 2017. Not only are they outdated, but they also collate every software, data processing, and computing process under the same industrial banner: ‘data processing, hosting, and related services’ in USEEIO and OpenCEDA, and ‘computer and related services’ in EXIOBASE. Organisations that use spend-based factors therefore fail to account for the specificity of cloud usage patterns, and the differentiation between cloud workloads. They also have no visibility into how to reduce cloud emissions, beyond simply spending (and therefore, using) less.
Cloud Service Provider Estimations: Isn’t this my CSP’s responsibility?
The three big Cloud Service Providers (CSPs) – AWS, Azure, and GCP – do provide carbon estimations that sit alongside customer billing data. These CSPs calculate cloud emissions with varying levels of granularity, but all adopt a top-down approach that calculates either total hardware power consumption (Azure and GCP) or total data center region power consumption (AWS) before allocating emissions to individual customers based on the proportion of server resources they have been allocated. This approach is much more reliable than spend-based factors, but it does not recognize real-time utilization of resources.
To take one example, AWS’ Customer Carbon Footprint Tool (CCFT) delivers both location-based and market-based emissions figures with a three-month lag. Location-based emissions account for the actual carbon intensity of the grid mix that powers a data center region, whilst market-based emissions deliver lower figures because they factor in AWS’ carbon offsetting and energy matching schemes.

A usage-based model does not account for offsetting or energy matching, because it reports the actual carbon emitted into the atmosphere as a result of power consumption. AWS does not document how it accounts for the emissions figures presented in Tailpipe’s billing account, beyond the high-level, generic overview provided in its Customer Carbon Footprint Methodology, which lacks any input data that would allow customers to verify their carbon figures. It also only delivers the two figures above, with no further granularity or recommendations for how to reduce them. Without reduction recommendations, organizations cannot deliver actionable carbon reduction strategies – other than, again, using the cloud less.
The Tailpipe Approach: How does it work, and why should I trust it?
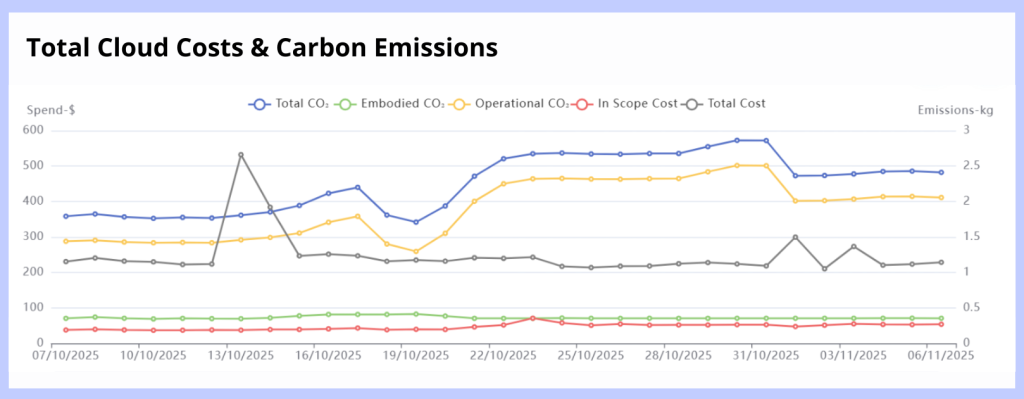
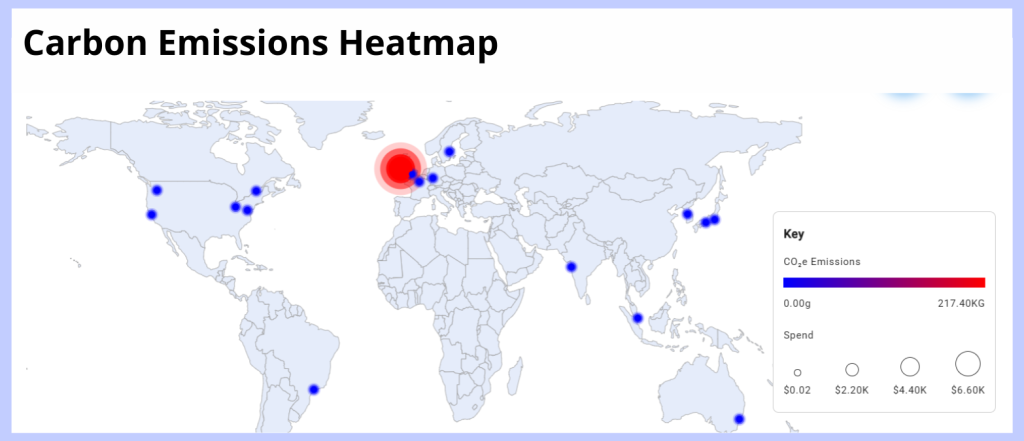
Tailpipe has pioneered a ground up approach to calculating cloud carbon emissions, which starts with the power draw of the actual hardware that a customer is utilizing – not a consumption-based allocation of total power. Drawing from an organization’s CSP billing data, manufacturer specifications, and data aggregators, Tailpipe knows exactly when and where an organization is using the cloud, their level of utilization, and the specific CPU, RAM, and GPU models being utilized in real time, along with the average power draw of other hyperscale server equipment. It uses this hardware data to calculate the power draw of that hardware at 5% CPU utilization increments, based on real-time stress-testing of CPU, RAM, and GPU models (documented in the Methodology). With power consumption calculated, Tailpipe factors in the carbon intensity of the local grid mixes that power the data centers in which an organization’s cloud services are hosted, delivering granular emissions data at the service and component level in near real-time. It then compares these emissions figures with best practice models, to suggest easy-to-implement and tailored recommendations to cut cloud carbon by up to 90% (and costs, by up to 30%).
To ensure that its data is reliable, Tailpipe carries out regular data validation tests. Tailpipe lab-tests the power consumption of bare metal and data center-based servers, comparing these live figures to those calculated by the Tailpipe methodology. Tailpipe always achieves a less than 10% variance between calculated and measured power and uses these tests to fine tune its methodology.
Want to find out more about your cloud emissions?
If your organisation wants real insights into its cloud infrastructure and is interested in optimising for both carbon and cost, get in touch with the Tailpipe team at [email protected].
If you’d like to learn more about how Tailpipe calculates and validates cloud carbon, see our open-source Methodology or worked examples for a detailed breakdown.
We use cookies to improve your experience on our site. By using our site, you consent to cookies.
Websites store cookies to enhance functionality and personalise your experience. You can manage your preferences, but blocking some cookies may impact site performance and services.
Essential cookies enable basic functions and are necessary for the proper function of the website.
Google reCAPTCHA helps protect websites from spam and abuse by verifying user interactions through challenges.
Statistics cookies collect information anonymously. This information helps us understand how visitors use our website.
Google Analytics is a powerful tool that tracks and analyzes website traffic for informed marketing decisions.
Service URL: policies.google.com (opens in a new window)
You can find more information in our Cookie Policy and Privacy Policy.