Data center energy consumption is expected to double between 2025 and 2030 (IEA), driven primarily by an exponential rise in AI usage. This growth will have a significant effect on IT’s carbon footprint, which already stands at 1.7% of global emissions (The World Bank).
That’s why Tailpipe has developed an innovative methodology to calculate the emissions generated by an organization’s use of AI, whether via the cloud (AWS Bedrock and Azure Foundry) or directly from an AI provider. Tailpipe calculates the carbon emissions resulting from AI usage using a methodology aligned with the Green Software Foundation’s Software Carbon Intensity for AI standard.
Tailpipe first calculates the power consumption (kWh) of the customers usage of AI, by multiplying the number of tokens a customer processes through an AI model, by the power draw per token of that model. The carbon emissions are then calculated by multiplying that power draw by the carbon intensity (gCO2e/kWh) of the electricity source that powered the customer’s use of AI.
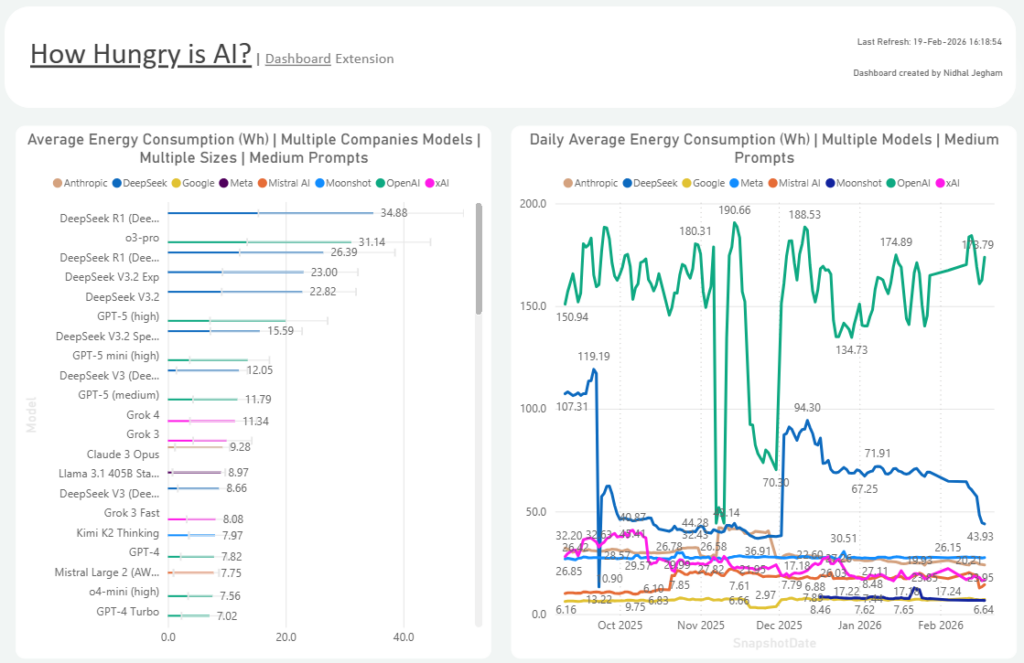
Tailpipe sources the power draw of individual AI models from an exclusive live dataset developed by Nidhal Jegham, the researcher behind the landmark 2025 study into AI carbon emissions, How Hungry is AI? (Jegham et al., 2025). This dataset measures the power consumption of 81 different AI models across seven providers for a 1,000 token query and is updated on a weekly basis.
The carbon emissions of a customer’s usage of AI are calculated as:
(Token Count per model * Power Draw per Token of the model) * Power Factors * Carbon Intensity
Where Power Factors are:
Power Supply Efficiency – the power lost between data center mains electricity and server.
Power Transmission Losses – the power lost between power station and data center mains electricity.
Power Usage Effectiveness – the excess power consumed by a data center outside of server hardware, such as for cooling.
And Carbon Intensity is the grams of CO2e generated per kWh of electricity for the grid mix that has powered the data center that is hosting the customer’s AI services.
AWS Bedrock
Services Covered: all text, image, and video generation foundational models available through AWS Bedrock.
Tailpipe calculates the power drawn by every generative text AI model available through AWS Bedrock in two ways:
- Text models available in Bedrock that are measured in the How Hungry is AI live dataset draw a live power draw figure directly from the dataset.
- Text models that are not measured in the How Hungry is AI dataset are categorized based on model parameter size (Nano (<7B), Micro (7–20B), Small (20–40B), Medium (40–70B), and Large (>70B)) and allocated the average power draw for their model size.
Image and video generation models are allocated the following power draw values:
|
Output |
Power Draw (Wh) |
Rate |
Source |
|
Standard 1024×1024 Image |
1.2 |
Per image |
MIT Technology Review, 2025 |
|
Standard 1792×1024 Image |
2.1 |
Per image |
Scope3 AI, 2025 |
|
HD 1024×1024 Image |
2.4 |
Per image |
Scope3 AI, 2025 |
|
HD 1792×1024 Image |
4.2 |
Per image |
Scope3 AI, 2025 |
|
Average Image (definition unknown) |
2.48 |
Per image |
Average |
|
480p Video |
251.78 |
Per second |
MIT Technology Review, 2025 |
|
540p Video |
566.51 |
Per second |
Hugging Face, 2025 |
|
720p Video |
1007.12 |
Per second |
Hugging Face, 2025 |
|
1080p Video |
4028.48 |
Per second |
Hugging Face, 2025 |
Tailpipe draws the number of tokens generated by a customer using a Bedrock service from their Cost and Usage Report files, as well as the location of the data center that has processed the customer’s AI requests.
Microsoft Foundry
Services Covered: 81 of the most common text, image, and video generation foundational models available through Microsoft Foundry (Anthropic, DeepSeek, OpenAI, Google, xAI, Meta, and Mistral AI).
Tailpipe only calculates the emissions of AI models available in Microsoft Foundry if they are also listed in the How Hungry is AI? dataset. This is because Microsoft Foundry hosts over 11,000 AI models, making it impossible to accurately source or estimate the parameter size for each model individually, and therefore to apply an average power draw based on model size as is done with the smaller pool of AWS Bedrock models.
Image and video generation models are allocated the following power draw values:
|
Output |
Power Draw (Wh) |
Rate |
Source |
|
Standard 1024×1024 Image |
1.2 |
Per image |
MIT Technology Review, 2025 |
|
Standard 1792×1024 Image |
2.1 |
Per image |
Scope3 AI, 2025 |
|
HD 1024×1024 Image |
2.4 |
Per image |
Scope3 AI, 2025 |
|
HD 1792×1024 Image |
4.2 |
Per image |
Scope3 AI, 2025 |
|
Average Image (definition unknown) |
2.48 |
Per image |
Average |
|
480p Video |
251.78 |
Per second |
MIT Technology Review, 2025 |
|
540p Video |
566.51 |
Per second |
Hugging Face, 2025 |
|
720p Video |
1007.12 |
Per second |
Hugging Face, 2025 |
|
1080p Video |
4028.48 |
Per second |
Hugging Face, 2025 |
Tailpipe sources the number of tokens generated by a customer using an in-scope Foundry service and the location of the data centers that have processed their AI requests from the customer’s billing files.
AI Proxy
Services Covered: A range of text generation models from Anthropic, Google, Mistral, and OpenAI.
Tailpipe calculates the power drawn by these models in two ways:
- Models that are measured in the How Hungry is AI live dataset draw a live power draw figure directly from the dataset.
- Models that are not measured in the How Hungry is AI dataset are categorized based on model parameter size (Nano (<7B), Micro (7–20B), Small (20–40B), Medium (40–70B), and Large (>70B)) and allocated the average power draw for their model size.
Tailpipe draws the number of tokens generated by a customer using one of the in-scope AI models via a lightweight, transparent proxy that sits between the customer’s AI applications and the AI provider’s API.
How it Works:
- The AI application sends its API request to the Tailpipe proxy endpoint instead of directly to the provider.
- The proxy forwards the request to the correct provider, unmodified.
- As the provider streams or returns its response, the proxy passes it back to the customer’s application in real time while extracting token usage metadata from the response headers and body.
- A telemetry record is written asynchronously to a streaming data pipeline (AWS Kinesis Firehose), ensuring zero impact on response latency.
- Telemetry records are batched and delivered to cloud storage, where daily compaction consolidates them into structured, query-ready files.
The data collected is limited to: provider and model type, token counts, output type (i.e. text generation, image generation, embedding), latency (the request duration), and timestamp of when the request occurred. The proxy extracts only operational metadata from the API traffic; no prompts, completions, or user data is ever stored in the telemetry pipeline.
Because Tailpipe’s telemetry Proxy cannot identify the location of specific data centers that are processing a customer’s AI requests, a global Power Usage Effectiveness (PUE) and Carbon Intensity is used. Global carbon intensity is drawn from Ember, and a global average PUE of 1.54 is sourced from the Uptime Institute (2025).
Example
A medium-sized organization has a license through AWS Bedrock to use Anthropic’s Claude Sonnet 4. In a month, their employees input and generate a total of 15,000,000 tokens in conversations.
Tailpipe draws this token count from the customer’s Cost and Usage Report. It then finds the power draw per token of Claude Sonnet 4 (0.00245 Wh as of February 2025).
0.00245 * 15,000,000 = 36,750 Wh
Tailpipe then finds the location in which this organization’s cloud services are based: AWS region eu-central-1, in Frankfurt. The power factors are added to the baseline power draw:
= Power Draw * Power Supply Efficiency * Power Transmission Losses * Power Usage Effectiveness
= 36,750 * 1.04 * 1.08 * 1.35
= 55,724.76 Wh
This means that this organization is responsible for 55.72 kWh of electricity consumption. Tailpipe then factors in the carbon intensity of the German grid mix: 332 gCO2e/kWh.
= 55.72 * 332
= 18,499.04 gCO2e
This means that the organization’s use of Claude Sonnet 4 has generated 18.5 kgCO2e. That’s the same as driving 68 miles in a petrol car.


