Data center energy consumption is expected to double between 2025 and 2030 (IEA), driven primarily by an exponential rise in AI usage. This growth will have a significant effect on IT’s carbon footprint, which already stands at 1.7% of global emissions (The World Bank).
Tailpipe calculates the carbon emissions of an organization’s use of AI, whether through the cloud (AWS Bedrock, Microsoft Foundry) or directly from an AI provider, using a methodology aligned with the Green Software Foundation’s Software Carbon Intensity for AI (SCI-AI) standard.
Tailpipe does not run the inference hardware, so it cannot measure energy directly. Instead it estimates energy from the tokens a customer processes: the per-token power draw of each model is multiplied by the number of tokens processed, then by the carbon intensity (gCO₂e/kWh) of the electricity that powered the request. Because the per-token figure is an estimate, Tailpipe reports it as a range with a confidence label, drawn from a tiered source waterfall rather than given as a single exact value.
How the calculation works
The carbon emissions of a customer’s AI usage are calculated as:
(Token Count per model × Power Draw per Token of the model) × Power Factors × Carbon Intensity
The sections below describe how each term is determined: the per-token power draw through a tiered source waterfall, the power factors that account for losses and data-center overhead, and the carbon intensity of the grid that powered the request.
The source waterfall
Tailpipe resolves each model’s per-token energy through a four-tier waterfall. A model is placed at the highest tier for which a real, published input exists; it is never placed higher on the basis of a guess.
| Tier | Source | Confidence |
|---|---|---|
| Tier 1 — Vendor-disclosed | The provider’s own published per-model energy figure (for example, a vendor lifecycle assessment such as Mistral’s). | Measured |
| Tier 2 — Directly measured | An independent measurement of the exact model, such as the ML.Energy or AI Energy Score benchmarks (open-weight models that appear in those benchmarks). | Measured |
| Tier 3 — Parametric, measurement-anchored | The EcoLogits active-parameter regression, emitted as a range, for models with a credible disclosed active-parameter count. | Modeled |
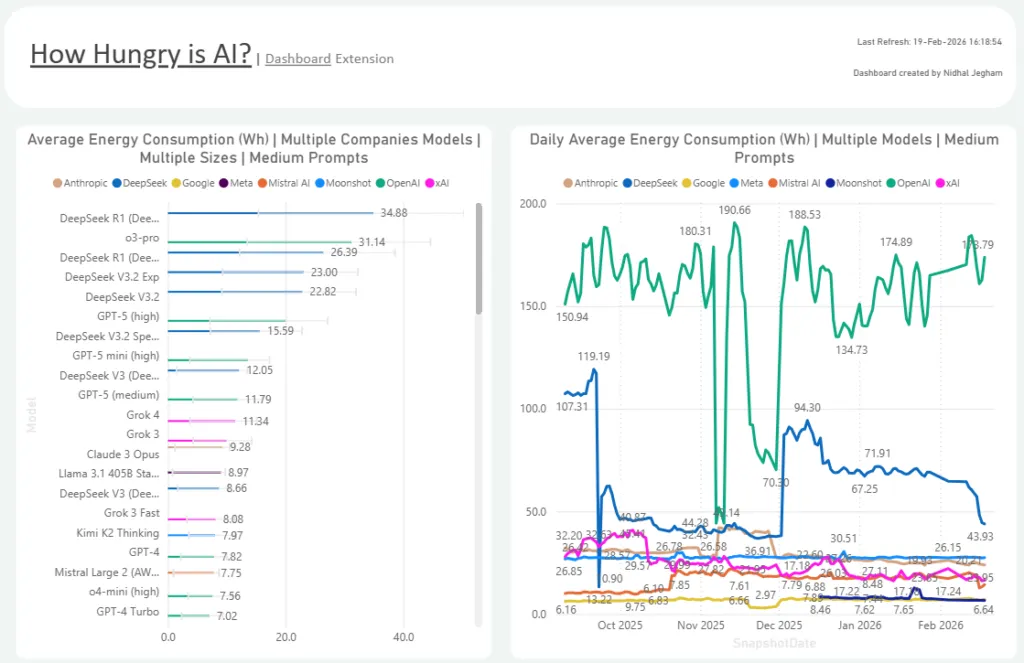
| Tier 4 — Throughput fallback | A throughput-based estimate from the Jegham / Artificial Analysis “How Hungry is AI?” dataset (Jegham et al., 2025), cross-checked against an external anchor. | Estimated |
Most major proprietary models sit at Tier 4 today. Claude, GPT, and Gemini are not independently benchmarked and their parameter counts are undisclosed, so they resolve at the throughput-estimate tier and are reported as a wide range labelled estimated. Tailpipe does not report a more precise figure than the available evidence supports. Vendor-disclosed or openly benchmarked models, such as Mistral-family and open-weight models, can reach the higher measured tiers where a real figure exists.
Every metered model carries a stored provenance record: its tier, source, the basis for the figure (a vendor document, a benchmark, a parameter count, or a throughput estimate), and the outcome of the cross-check below. Any figure on the dashboard can therefore be traced back to its source.
Cross-checking higher-tier figures
Where a model has both a higher-tier figure and the Tier-4 throughput estimate, the two must agree. Tailpipe applies two separate checks:
- The >2× cross-check gate decides which figure ships. If the higher-tier figure and the Tier-4 estimate agree within a factor of two, the higher-tier value and its range are used. If they diverge by more than 2× and no Tier-1 vendor figure is available to break the tie, the model ships on the Tier-4 estimate, flagged low-confidence, and the unreconciled higher-tier number is not shown to customers. A Tier-1 vendor figure always wins.
- An order-of-magnitude sanity floor checks every shipped figure against an independent external reference. This is a separate bar from the cross-check gate: clearing the floor does not promote a figure past the >2× gate.
Ranges and confidence
Every per-token figure, and the energy and carbon totals built from it, is reported as a range (a low, expected, and high value) with a confidence label: measured, modeled, or estimated. Tailpipe does not publish point values to four decimal places when the underlying uncertainty is a factor of several. The confidence label follows the waterfall tier: Tiers 1 and 2 are measured, Tier 3 is modeled, and Tier 4 is estimated.
Input and output tokens
A request has two kinds of tokens, and they do not cost the same amount of energy. Input (prefill) tokens are the prompt the model reads; output (decode) tokens are the text it generates. Generating output is more energy-intensive per token than reading input, because the model produces output one token at a time, whereas it can process all the input tokens in parallel. Recent measurement studies of per-query LLM energy consistently show decode costing several times more per token than prefill.
Tailpipe meters the two with separate per-token coefficients rather than applying one blended figure to both, so output is charged at its true higher cost instead of being averaged with cheaper input tokens. The remaining token types follow from these two: a cache write is charged as a full input pass, a cache read at about 2% of an input token (see Prompt Caching below), and reasoning tokens at the output coefficient (see Reasoning tokens below).
On workloads dominated by cached context, input and output together are a small share of total energy, so the split is mainly a matter of accuracy rather than a large change to the headline figure. It is, however, the best-evidenced refinement in the methodology, and it keeps the per-token accounting defensible.
Power factors
The raw per-token energy is adjusted by three multipliers that account for energy lost or consumed before and around the server:
- Power Supply Efficiency (PSE) – the power lost between the data center’s mains supply and the server (×1.04).
- Power Transmission Losses – the power lost between the power station and the data center’s mains supply (×1.08).
- Power Usage Effectiveness (PUE) – the additional power a data center draws beyond the server hardware itself, such as for cooling.
PUE is provider-specific wherever the provider is known, rather than a single global figure:
| Provider | PUE | Source |
|---|---|---|
| Anthropic (on AWS) | 1.15 | AWS 2024 fleet average |
| OpenAI (on Azure) | 1.17 | Microsoft Azure, FY25 |
| 1.09 | Google 2024 fleet average |
A global PUE of 1.54 (Uptime Institute, 2025) is used only where the provider, and therefore its data-center efficiency, is unknown.
Carbon intensity
Carbon emissions are the energy figure multiplied by the carbon intensity of the electricity that powered the request: the grams of CO₂e per kWh for the relevant grid mix.
Tailpipe uses location-based grid intensity for the provider and region where the region is known, and hourly or marginal intensity where it is available, rather than an annual average (annual averages can be roughly a factor of two off the marginal figure). Where the region is not known, a global average is used and labelled as such. The energy figure and the grid factor are kept as separate, inspectable inputs, so a carbon number can be broken down into how much energy was used and how clean the grid was.
Reasoning (“thinking”) tokens
Reasoning models generate large volumes of internal “thinking” tokens before producing their visible answer. These are generated tokens, so Tailpipe meters them at the output energy coefficient. This follows the AI Energy Score (v2) finding that reasoning models draw far more energy than non-reasoning models, almost entirely through their output-token count.
Reasoning tokens are always a subset of the output tokens, never added on top; counting them separately would double-count energy that is already in the output figure. Today only OpenAI’s o-series reports a distinct reasoning-token count to Tailpipe. For Anthropic and Google’s Gemini, the thinking tokens are already folded into the output count: Anthropic bills them inside output with no separate breakdown, and Gemini’s thinking tokens are merged into output when captured. Either way, their reasoning energy is counted as output.
Prompt Caching
Several AI providers, such as Anthropic, support prompt caching, where a previously processed section of a prompt is reused across requests instead of being recomputed. When a cached section is read, the model reuses computation it has already done rather than reprocessing those tokens, so a cached read draws far less power than processing the same tokens from scratch. Tailpipe estimates a cached read at around 2% of the power draw of an equivalent input token, and treats tokens written to the cache as a full processing pass. This 2% is an estimate: a cached read still loads the stored context and processes the new tokens around it, but it does not repeat the original computation. It is a separate consideration from the pricing discount that providers apply to cached tokens, which is set by billing rather than by energy use. Accounting for caching this way keeps Tailpipe from overstating cache-heavy workloads such as coding assistants, where cached context can account for the majority of the tokens processed.
Coverage by platform
AWS Bedrock
Services covered: all text, image, and video generation foundational models available through AWS Bedrock.
For every text model, Tailpipe resolves the per-token energy through the source waterfall above. Models present in the Tier-4 “How Hungry is AI?” throughput dataset use that figure directly. Models that are not in the dataset are estimated from the average for their parameter-size band: Nano (<7B), Micro (7–20B), Small (20–40B), Medium (40–70B), or Large (>70B). This size-band estimate is the lowest-confidence rung of Tier 4; it is labelled estimated and reported as a wide range, not as a confident figure.
Image and video generation models are allocated the following power draw values:
Output | Power Draw (Wh) | Rate | Source |
Standard 1024x1024 Image | 1.2 | Per image | MIT Technology Review, 2025 |
Standard 1792x1024 Image | 2.1 | Per image | Scope3 AI, 2025 |
HD 1024x1024 Image | 2.4 | Per image | Scope3 AI, 2025 |
HD 1792x1024 Image | 4.2 | Per image | Scope3 AI, 2025 |
Average Image (definition unknown) | 2.48 | Per image | Average |
480p Video | 251.78 | Per second | MIT Technology Review, 2025 |
540p Video | 566.51 | Per second | Hugging Face, 2025 |
720p Video | 1007.12 | Per second | Hugging Face, 2025 |
1080p Video | 4028.48 | Per second | Hugging Face, 2025 |
Tailpipe draws the number of tokens a customer generates through a Bedrock service, and the location of the data center that processed the requests, from their Cost and Usage Report files.
Microsoft Foundry
Services covered: the most common text, image, and video generation foundational models available through Microsoft Foundry (Anthropic, DeepSeek, OpenAI, Google, xAI, Meta, and Mistral AI).
Microsoft Foundry hosts over 11,000 models. Tailpipe meters those it can resolve through the waterfall with a real input (primarily models present in the Tier-4 throughput dataset), rather than assigning a size-band estimate to every one of thousands of models whose parameter size cannot be reliably established. Where a model cannot be resolved with a real input, it is not given a fabricated figure.
Image and video generation models are allocated the following power draw values:
Output | Power Draw (Wh) | Rate | Source |
Standard 1024x1024 Image | 1.2 | Per image | MIT Technology Review, 2025 |
Standard 1792x1024 Image | 2.1 | Per image | Scope3 AI, 2025 |
HD 1024x1024 Image | 2.4 | Per image | Scope3 AI, 2025 |
HD 1792x1024 Image | 4.2 | Per image | Scope3 AI, 2025 |
Average Image (definition unknown) | 2.48 | Per image | Average |
480p Video | 251.78 | Per second | MIT Technology Review, 2025 |
540p Video | 566.51 | Per second | Hugging Face, 2025 |
720p Video | 1007.12 | Per second | Hugging Face, 2025 |
1080p Video | 4028.48 | Per second | Hugging Face, 2025 |
Tailpipe sources the number of tokens a customer generates through an in-scope Foundry service, and the location of the data centers that processed the requests, from the customer’s billing files.
AI Proxy
Services covered: a range of text generation models from Anthropic, Google, Mistral, and OpenAI.
Tailpipe resolves the per-token energy of these models through the same source waterfall: models in the Tier-4 throughput dataset use that figure, and models that are not are estimated from their parameter-size band as the lowest-confidence rung of Tier 4, reported as a range.
Tailpipe captures token counts for these models through a lightweight, transparent proxy that sits between the customer’s AI applications and the AI provider’s API.
How it works:
- The AI application sends its API request to the Tailpipe proxy endpoint instead of directly to the provider.
- The proxy forwards the request to the correct provider, unmodified.
- As the provider streams or returns its response, the proxy passes it back to the customer’s application in real time while extracting token usage metadata from the response headers and body.
- A telemetry record is written asynchronously to a streaming data pipeline (AWS Kinesis Firehose), ensuring zero impact on response latency.
- Telemetry records are batched and delivered to cloud storage, where daily compaction consolidates them into structured, query-ready files.
The data collected is limited to: provider and model type, token counts, output type (i.e. text generation, image generation, embedding), latency (the request duration), and timestamp of when the request occurred. The proxy extracts only operational metadata from the API traffic; no prompts, completions, or user data is ever stored in the telemetry pipeline.
Because the proxy cannot identify the specific data center that processed a request, the region is unknown, so Tailpipe applies a global average carbon intensity (from Ember) at the carbon step. The provider is known, however, so the provider-specific PUE above still applies (for example, Anthropic’s 1.15 rather than the global 1.54).
Reduction Recommendations
As well as measuring an organization’s AI footprint, Tailpipe suggests practical ways to reduce it. Recommendations are ordered by the projected saving in operational emissions, on the same operational basis as the footprint above; as elsewhere on the AI path, Tailpipe counts operational emissions only and does not add embodied or manufacturing emissions. A cost figure is shown next to a recommendation where one can be worked out, but it is the carbon saving that sets the order, not the cost. Tailpipe needs at least 30 days of usage before it makes any recommendation. Each one shows the saving over the most recent 30 days, and the combined total across all of them is also projected to a full year. Every recommendation carries a confidence score and a sense of how much effort it takes to apply.
Switching to a lower-energy model. Where a workload is running on a larger model than it needs, Tailpipe can suggest a smaller model from the same product line and provider, such as a lighter version of the model already in use. The saving is the workload’s recorded emissions reduced in line with the fall in energy per token between the two models, weighted by the organization’s own mix of input and output tokens, and a switch is only suggested when that fall is at least around 10%. Two conditions limit when this is offered: Tailpipe only ever points to a smaller model in the same family, never an unrelated one that might not cope with the task; and it only compares models whose energy has been measured directly, rather than weighing one estimate against another. That keeps the suggestion rare for now, and it becomes more common on its own as more models gain measured energy figures.
Trimming output-heavy workloads. Generating output tokens uses considerably more energy than reading input tokens, as described under Input and output tokens above. When a workload produces far more output than input across a reasonable number of requests, Tailpipe points out that more concise prompts, or a structured output format, can cut back the longer responses. The saving is based on the measured difference between the model’s output and input energy per token, and is applied only to the output above the expected ratio; that keeps it cautious even if a tighter prompt simply moves tokens from output into input rather than removing them. Where a model’s output and input energy have not yet been measured separately, the suggestion is left out rather than guessed.
Moving to a greener region. On platforms where the inference region can be chosen, such as AWS Bedrock, Google Vertex AI, and Azure OpenAI, Tailpipe can suggest running a workload in a region with a cleaner grid. It never applies to AI used directly from a provider’s own API, where there is no region to choose. Because the comparison is between two real grids, the percentage reduction is exact; the absolute saving in kgCO₂e carries the same uncertainty as the per-token energy behind the footprint, so it should be read as an estimate rather than a precise figure. A move is only suggested when the region was actually reported by telemetry, never when it has been assumed from a provider default.
Confidence and cost. The confidence on each recommendation reflects how much usage data lies behind it and how well the model’s energy is known: it is highest where that energy is measured and lower where it is modeled or estimated. The cost figure is an API-equivalent estimate, meaning what the affected usage would cost at a provider’s published pay-per-token rates. It is not a subscription bill, and for an organization on a fixed-price plan it is not money actually spent; it is there to give a sense of scale, which is why the carbon saving, rather than the cost, leads each recommendation and sets the order.
A worked region-move recommendation: an organization runs Claude on AWS Bedrock in a region whose grid averages around 500 gCO₂e/kWh, with that region reported by telemetry, while a cleaner Bedrock region for the same platform averages around 350 gCO₂e/kWh. The reduction is exactly (500 − 350) / 500, or 30%, so a workload recorded at 20 kgCO₂e over the most recent 30 days would save around 6 kgCO₂e. That 6 kg carries the same uncertainty as the per-token energy estimate behind the original 20 kg, so it is indicative rather than exact. The grid figures used here are illustrative.
Standards alignment
Tailpipe maps its AI methodology to the standards customers report under.
GHG Protocol. Inference energy is reported in line with the GHG Protocol’s Scope 2 guidance, using both location-based and (where a market instrument applies) market-based grid factors. For a customer buying API inference, that energy sits in their Scope 3 value chain; Tailpipe quantifies it at the activity level so it can be allocated there.
ISO 14064-1. The standard requires a greenhouse-gas quantification to disclose its uncertainty. Tailpipe’s per-model provenance records and published ranges provide that uncertainty assessment: every figure carries its source, tier, and confidence rather than a single unqualified number.
Green Software Foundation SCI / SCI-AI. The SCI specification expresses software carbon intensity as SCI = (E × I + M) / R, where E is energy, I is grid carbon intensity, M is embodied emissions, and R is a functional unit. Tailpipe’s AI accounting is operational-only, so M (embodied emissions) is not included and the effective figure is E × I / R. The remaining terms map directly: E is the token count × per-token coefficient × power factors, I is the location-based grid intensity, and R is the unit of work (a token or a request). The SCI-AI fields (token counts, model identification, output type) are captured by the telemetry described above.
EU AI Act Code of Practice. The Code of Practice is moving toward a standardized inference-energy disclosure benchmark for general-purpose AI models. Tailpipe’s provenance-labelled per-model figures and ranges are intended to let customers report against that benchmark as it takes shape. Tailpipe tracks the benchmark; it does not claim certification under it.
Worked example
A medium-sized organization licenses Anthropic’s Claude Sonnet 4 through AWS Bedrock. In a month, their employees input and generate a total of 15,000,000 tokens in conversations.
Tailpipe draws this token count from the customer’s Cost and Usage Report and resolves Claude Sonnet 4’s per-token energy through the waterfall. Claude Sonnet 4 is an undisclosed-parameter closed model that is not independently benchmarked, so it resolves at Tier 4, the throughput-estimate tier, and its figure is reported as an estimated-confidence range rather than a single exact value. Taking the expected per-token estimate (≈0.00245 Wh, applied here as a single blended rate across input and output for simplicity):
0.00245 × 15,000,000 = 36,750 Wh
The power factors are applied. Because the provider is Anthropic on AWS, the provider-specific PUE of 1.15 is used (not the global 1.54):
= Power Draw × PSE × Transmission × PUE
= 36,750 × 1.04 × 1.08 × 1.15
= 47,469 Wh
So the organization is responsible for roughly 47.5 kWh of electricity consumption. Tailpipe then applies the carbon intensity of the grid that powered the request: for AWS region eu-central-1, in Frankfurt, the German grid mix at 332 gCO₂e/kWh:
= 47.47 × 332
= 15,760 gCO₂e
This puts the organization’s use of Claude Sonnet 4 at roughly 15.8 kgCO₂e, about the same as driving 58 miles in a petrol car.
Because Claude Sonnet 4 sits at Tier 4, the dashboard does not present this as a single point. It is shown as an estimated-confidence band around the expected value: the arithmetic relationships above are exact, but the absolute magnitude carries the throughput estimate’s uncertainty, so it is reported as a range rather than a precise number.